What can be done
What can be done about the big ocean changes?
Cutting emissions is the only way to keep tipping thresholds out of reach, and the world is not on track. Protecting the ocean now helps reefs, fish stocks and coasts recover between shocks, though it cannot stop the heat, and protection needs to be paid for. Changes that can no longer be avoided have to be planned for.
Limit warmingProtect the oceanThe ocean can recoverPay for protection
1 · Limit warming
How much emissions must fall
Today’s policies lead to about 2.8°C of warming by 2100, and the full set of national pledges to about 2.6°C (UNEP, 2026). Both pass the estimated thresholds for coral reefs, the ice sheets and the subpolar North Atlantic, and enter the range in which an Atlantic circulation collapse becomes possible. Holding warming to 1.5°C without overshooting it is no longer possible. The fastest feasible cuts would still peak at about 1.8°C before carbon removal brings warming back down.
- 130 Gtof CO₂ left from the start of 2026 for an even chance of holding warming to 1.5°C: a little more than three years of current emissions (Forster et al., 2026).
- −45%cut in greenhouse gas emissions by 2035, from 2025 levels, on the fastest feasible path. Countries’ pledges deliver 11–15% (UNEP, 2026).
- +0.1°Cadded to peak warming by every five more years of emissions at today’s level (UNEP, 2026).
- 320 Gtof CO₂ to be removed from the air this century to bring warming back below 1.5°C on that path, about eight years of 2024 emissions (UNEP, 2026).
Warming values are those the world would likely not exceed (a 66% chance). Carbon budgets shift by about 200 Gt either way depending on how far methane and other gases are cut.
Peak warming and overshoot both matter
In a model of four interacting tipping systems (Greenland, West Antarctica, the Atlantic circulation and the Amazon), following current policies this century commits the world to a 45% risk that at least one tips by 2300, even if temperatures are later brought back below 1.5°C. Paths that overshoot 1.5°C by less than 0.1°C keep that risk below 1% (Möller et al., 2024). A recent review concludes that warming must peak below 2°C, return below 1.5°C within this century and fall to about 1°C after that (Ritchie et al., 2026).
Coral reefs
Fast-responding systems such as reefs are especially vulnerable to overshoot (Ritchie et al., 2026). Keeping functional reefs at scale needs warming back below 1.2°C and eventually towards 1°C (Global Tipping Points Report 2025). Until then, protection decides which reefs come through.
Ice sheets
Slow to respond, so a short overshoot may not tip them, but each degree of peak warming commits metres of eventual sea-level rise. The safe long-term level is likely closer to 1°C (Stokes et al., 2025).
Atlantic circulation
There is some evidence that the circulation responds to how fast the world warms as well as how far, so limiting the rate of warming could itself be a goal (Global Tipping Points Report 2025).
El Niño
In model runs, every delay in reaching net zero made the shift to a more El Niño-like Pacific larger and longer-lasting (Sengupta et al., 2026).
2 · Protect the ocean
Protecting the ocean now
Warming sets the pressure; local pressures decide how much a system can take. Overfishing, pollution and habitat loss can lower the point at which reefs tip (Ritchie et al., 2026). Well-run protected areas remove some of those pressures and help ecosystems recover between shocks. Governments have agreed to protect 30% of the ocean by 2030, through areas that are “effectively conserved and managed” (Kunming-Montreal Global Biodiversity Framework, Target 3).
Share of the ocean in protected areas
Per cent of the global ocean, against the 30% target for 2030
About 10% of the ocean today.
Protected areas and other effective area-based conservation measures (OECMs), 1 January of each year; last point October 2026. UNEP-WCMC and IUCN, Protected Planet (WDPCA), October 2026 release. Earlier years are rebuilt from today’s database, so they can differ from figures published at the time. The 2017 jump is the Ross Sea MPA.
How strongly the ocean is protected
Per cent of the global ocean, marine protected areas only
Fully or highly protected areas ban or tightly limit extraction such as fishing and mining; their benefits are much larger than those of lightly protected areas (Grorud-Colvert et al., 2021). Source: MPAtlas, Marine Conservation Institute, analysis of 20 October 2026, using The MPA Guide.
About 10% of the ocean is now in protected areas, up from 3% in 2010. Most of it lies in national waters, where 23% is protected. On the high seas, which cover 61% of the ocean, it is under 2% (Protected Planet, October 2026). The High Seas Treaty entered into force on 17 January 2026 and makes high-seas protected areas possible for the first time; its first meeting of the parties is due in January 2027. Strong protection is rarer: 3.5% of the ocean is fully or highly protected in areas that are actually in place (MPAtlas, October 2026).
What protection does
- Fish biomass in no-take reserves is typically about three times that of comparable fished areas (median +194% across 124 reserves; Lester et al., 2009).
- Reserves that are no-take, enforced, old, large and isolated hold five times the biomass of large fish and 14 times the shark biomass of fished areas. Most protected areas have only one or two of these features and look like fished sites (Edgar et al., 2014).
- On the Great Barrier Reef, reef communities inside protected zones recovered 20% faster after disturbances (Mellin et al., 2016).
- Fish spill over to nearby fisheries: tuna catch rates rose near Hawaii’s expanded Papahānaumokuākea monument (Medoff et al., 2022).
- Mangroves avert more than US$65 billion of flood damage a year; without them 15 million more people would be flooded every year (Menéndez et al., 2020).
What it cannot do
- Protection gives little or no resistance to extreme heat. During the 2016 bleaching on the Great Barrier Reef, local protection and water quality made little difference (Hughes et al., 2017).
- After mass bleaching in the Seychelles, being in a no-take reserve did not predict which reefs recovered (Graham et al., 2015).
- Protected areas warm like everywhere else: under very high emissions, climate change emerges by mid-century in 42% of no-take reserves (Bruno et al., 2018).
- So where protection goes matters. Choosing reefs with the best chance of coping with heat and reseeding others, as in a global portfolio of 50 reef areas, spreads the risk (Beyer et al., 2018).
- Paper parks do little. Protected areas with adequate staff had effects 2.9 times larger than those without (Gill et al., 2017).


The ocean can recover
Examples of recovery
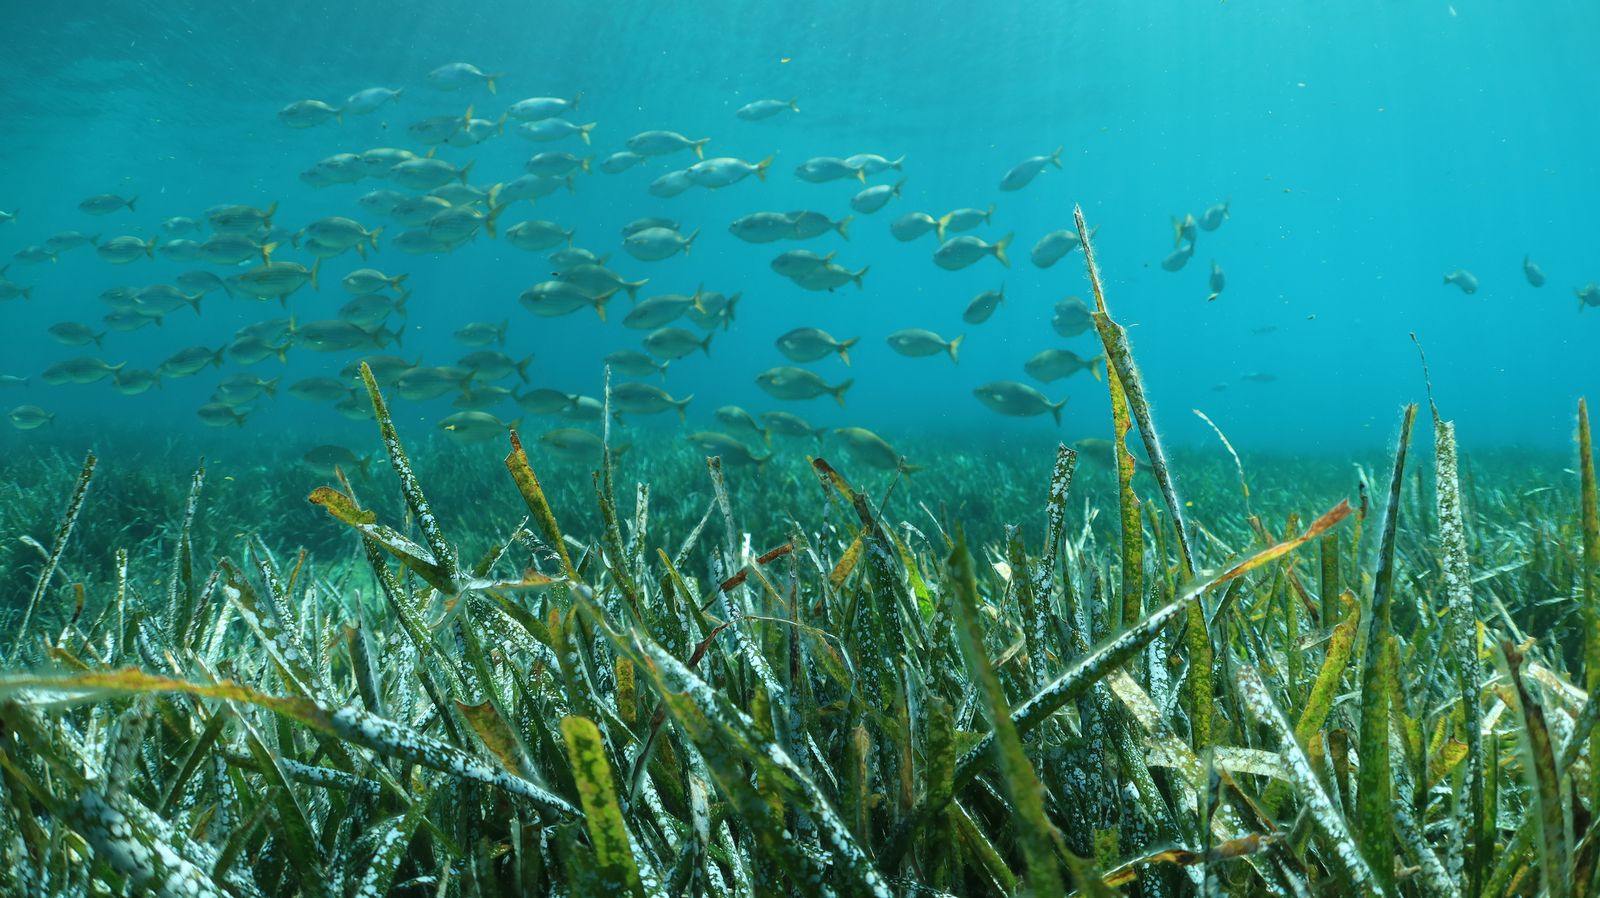
Marine life recovers, often faster than expected, when fishing, hunting and habitat loss are brought under control. A review of decades of evidence concluded that substantial recovery of marine life is achievable by 2050, if the major pressures, including climate change, are reduced (Duarte et al., 2020).
- +463%Cabo Pulmo, Mexico. Fish biomass rose more than fivefold between 1999 and 2009, after the local community backed closing its reef to fishing (Aburto-Oropeza et al., 2011).
- 93%Humpback whales. The western South Atlantic population, hunted down to about 450 animals in the 1950s, is back to 93% of its size before whaling (Zerbini et al., 2019).
- +28%Green turtles. Numbers have risen since the 1970s with beach protection and curbs on harvest and trade; IUCN moved the species from Endangered to Least Concern in 2025.
- RisingManaged fish stocks. Where stocks are assessed and managed, about half of the world’s catch, they are on average increasing (Hilborn et al., 2020).
- +37%Sea otters and kelp. Where sea otters have returned on Canada’s Pacific coast, kelp forests recover and the ecosystem holds 37% more life (Gregr et al., 2020).
- −23%Mangrove loss. The rate of global mangrove loss fell by 23% between 2000–2010 and 2010–2020 (FAO, 2023).
Recovery depends on removing local pressures and on limiting warming: protection cannot shield reefs from heat (see above), and fish stocks rebuild best under low emissions. As the 2025 film Ocean with David Attenborough puts it, “the ocean can recover faster than we had ever imagined”.
3 · Pay for protection
Protection is funded at about a tenth of what it needs
Managing 30% of the ocean well would cost about US$16 billion a year, most of it for running protected areas rather than creating them. About US$1.8 billion is spent (Systemiq, 2026). In a global survey, 65% of protected areas reported budgets too small for basic management (Gill et al., 2017). Governments spend more each year on fisheries subsidies that expand fishing capacity than the whole gap (Sumaila et al., 2019).
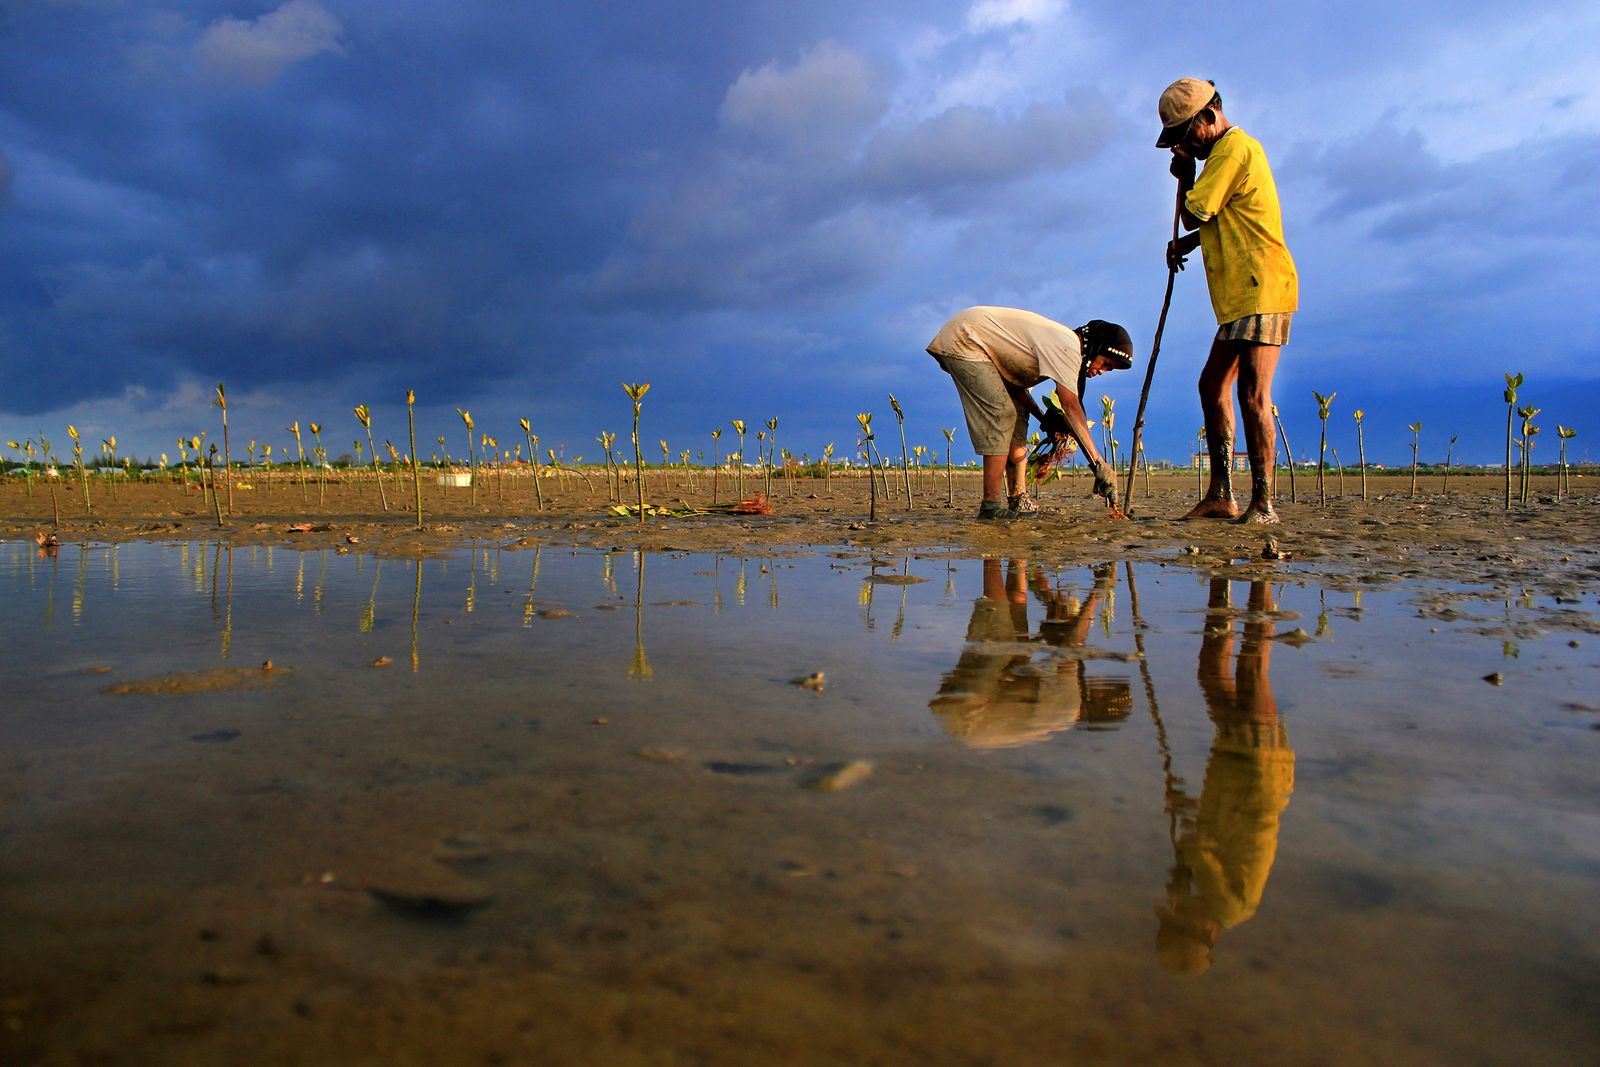
The investment case is positive. A peer-reviewed global study finds that the benefits of expanding marine protection exceed the costs by a factor of 1.4 to 2.7 (Brander et al., 2020). In Indonesia, a district-by-district cost-benefit analysis found that mangrove conservation and restoration pay off in most districts, and that conserving existing mangroves generally gives higher returns than restoring lost ones (van Zanten et al., 2025, co-authored by the curator of Ocean Turning Points).
Countries have agreed to mobilise at least US$200 billion a year for biodiversity by 2030 and to cut harmful subsidies by US$500 billion a year (Global Biodiversity Framework, Targets 18 and 19). A World Trade Organization agreement banning some harmful fisheries subsidies entered into force in September 2025.
Money for ocean protection, against what is needed
US$ billion a year
Need and spending: Systemiq, Ocean Protection Gap Report 2026, commissioned by the Bloomberg Ocean Fund; about 95% of the need is long-term management rather than creating new areas. Subsidies: Sumaila et al. (2019), Marine Policy, doi:10.1016/j.marpol.2019.103695.
| Country | Debt treated | For conservation | Protection commitment |
|---|---|---|---|
| Seychelles, 2016 | US$21.6m bought back | Trust fund (SeyCCAT), grants since 2018 | 30% of national waters, declared 2020 |
| Belize, 2021 | US$553m bond bought back at 55 cents | About US$180m over 20 years | 30% of its ocean by 2026 |
| Ecuador, 2023 | About US$1.6bn of bonds | More than US$450m over about 18 years | Galápagos marine reserves |
| Gabon, 2023 | US$500m | US$163m over 15 years | 30% of its ocean |
| Bahamas, 2024 | US$300m | US$124m over 15 years | Expanded marine protected areas |
Sources: SeyCCAT case study (2025); The Nature Conservancy, Belize case study and Gabon and Bahamas announcements; US International Development Finance Corporation, Ecuador. Figures for Ecuador, Gabon and the Bahamas are as reported by the arranging parties. The IMF notes that such swaps are usually too small to restore debt sustainability and that their efficiency case is narrow (Chamon et al., 2022). The first sovereign blue bond, US$15 million for Seychelles fisheries in 2018, has been followed by a market of about US$15 billion (World Bank, 2025).
Plan for what cannot be avoided
Decisions for each change
Atlantic circulation
Stress-test long-lived investments against a collapse and favour measures that pay off either way.
Coral reefs
Protect the reefs most likely to survive, support reef fishers through change, and plan for weaker natural coastal defences.
Ice sheets
Test long-lived coastal assets against a high-end rise and keep options open to raise defences or move.
El Niño
Act on forecasts with agreed triggers and pre-arranged finance; size reserves and insurance for stronger events.
Fish on the move
End overfishing and adapt quotas and agreements as stocks shift across borders.
Subpolar North Atlantic
Include abrupt regional cooling in risk assessments and link observations to decision points.
Keep watching
Long, unbroken ocean records underpin every one of these decisions. See who monitors the ocean, and where the gaps are.
Sources
Emissions and warming: UNEP (2026), Emissions Gap Report 2026; Forster et al. (2026), Earth System Science Data 18, 3889; Möller et al. (2024), Nature Communications 15, 6192; Ritchie et al. (2026), Environmental Research Letters 21, 043001; Stokes et al. (2025), Communications Earth & Environment 6; Sengupta et al. (2026), Communications Earth & Environment 7, 810; Global Tipping Points Report 2025; Armstrong McKay et al. (2022), Science 377.
Protected areas: UNEP-WCMC and IUCN (2026), Protected Planet: The World Database on Protected and Conserved Areas (WDPCA), October 2026, Cambridge, UK: UNEP-WCMC and IUCN. Available at protectedplanet.net. MPAtlas, Marine Conservation Institute (2026). Convention on Biological Diversity, Kunming-Montreal Global Biodiversity Framework. United Nations Treaty Collection, Agreement on Marine Biological Diversity of Areas beyond National Jurisdiction.
Evidence on protection: Lester et al. (2009), Marine Ecology Progress Series 384; Edgar et al. (2014), Nature 506; Gill et al. (2017), Nature 543; Grorud-Colvert et al. (2021), Science 373; Mellin et al. (2016), Ecology Letters 19; Medoff et al. (2022), Science 378; Hughes et al. (2017), Nature 543; Graham et al. (2015), Nature 518; Bruno et al. (2018), Nature Climate Change 8; Beyer et al. (2018), Conservation Letters 11; Menéndez et al. (2020), Scientific Reports 10.
Recovery: Duarte et al. (2020), Nature 580; Aburto-Oropeza et al. (2011), PLoS ONE 6; Zerbini et al. (2019), Royal Society Open Science 6; IUCN Red List update, October 2025; Hilborn et al. (2020), PNAS 117; Gregr et al. (2020), Science 368; FAO (2023), The world’s mangroves 2000–2020.
Finance: Systemiq (2026), Ocean Protection Gap Report 2026; Brander et al. (2020), Marine Policy 116; Sumaila et al. (2019), Marine Policy 109; van Zanten et al. (2025), Frontiers in Environmental Science 13, doi:10.3389/fenvs.2025.1459034; Chamon et al. (2022), IMF Working Paper 22/162.