If winter sinking south of Greenland stopped, the region could cool by 2–3°C within about a decade, even as the rest of the world warms. In climate models it is also the first step towards a wider Atlantic shutdown.
- What is it?
- A loop of currents south of Greenland where surface water cools and sinks every winter, one of the engines of the wider Atlantic circulation.
- How likely is it?
- Possible this century: a minority of climate models show collapse, more often among those that best match observations. The tipping threshold is uncertain, about 1.8°C (1.1–3.8°C).
- What would it mean?
- Abrupt cooling around the North Atlantic, shifts in European weather, changes in tropical rainfall and in fisheries.
- What can be done?
- Limit warming; include abrupt regional cooling in risk assessments; keep the ocean observing arrays running.
Model studiesObservations since 2014Reviewed 25 October 2026
What it is
How the subpolar gyre works
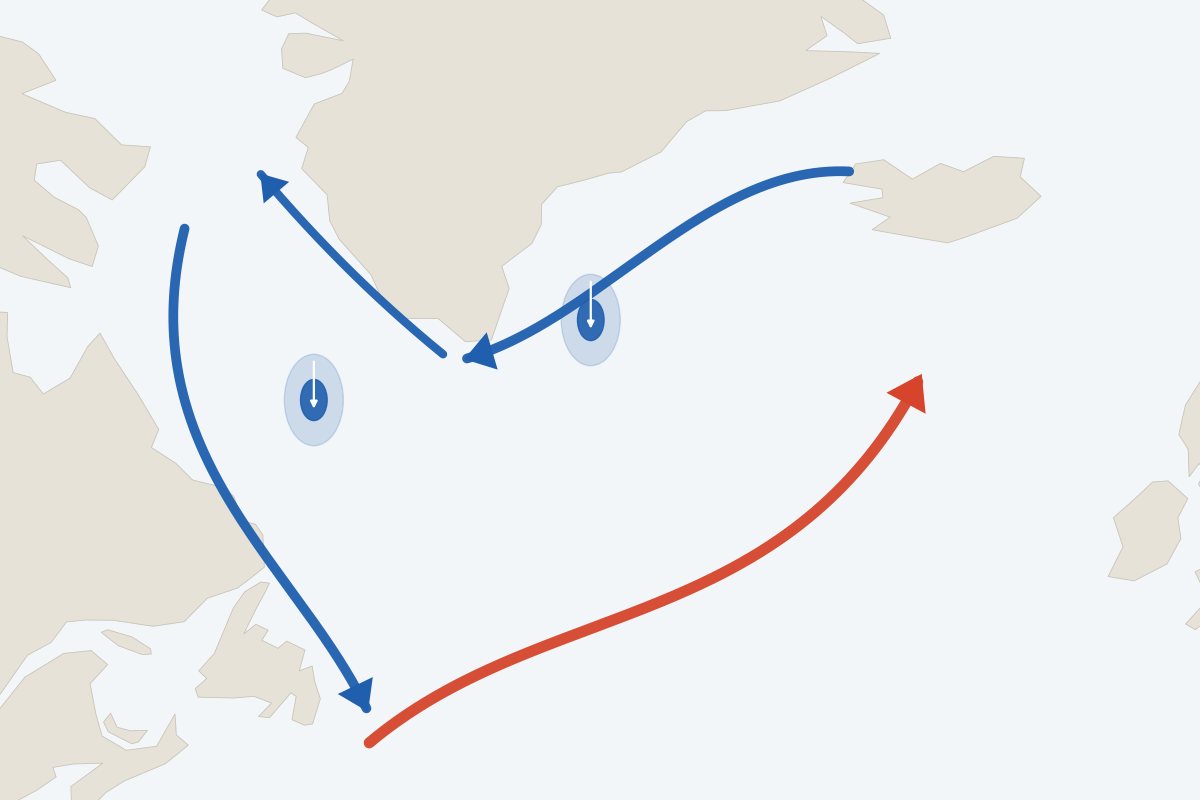
Warm, salty water from the south enters a large anticlockwise loop of currents between Labrador, Greenland and Iceland. In winter, cold air takes its heat, and in the Labrador and Irminger Seas the surface water becomes dense enough to sink, in some winters to more than 2,000 m. This sinking helps drive the deep, southward branch of the Atlantic circulation.
Sinking needs surface water that is cold and salty enough. Warming and extra fresh water from melting ice make it lighter. A simple model shows two stable states, with and without winter sinking (Born and Stocker, 2014). A collapse of the gyre would be faster and more regional than a collapse of the whole Atlantic circulation, but the two are linked: in every climate model run beyond 2100, the shutdown of the wider Atlantic overturning is preceded by a collapse of winter sinking in the Labrador, Irminger and Nordic Seas around mid-century (Drijfhout et al., 2025).

How likely
Collapse in climate models
In 7 of 40 older-generation climate models (CMIP5) and 4 of 35 current ones (CMIP6), winter sinking in the gyre collapses this century, cooling the region within about a decade (Sgubin et al., 2017; Swingedouw et al., 2021). Collapse is more common in the models that best reproduce the observed layering of the ocean: up to 46% and 36% of those subsets.
The Global Tipping Points Report 2025 assesses the gyre as a tipping system with medium confidence and says a collapse cannot be ruled out at current warming. Its threshold estimate is about 1.8°C of global warming, with a range of 1.1–3.8°C (Armstrong McKay et al., 2022). Today’s warming is about 1.4°C.
Direct measurements of overturning in the region began only in 2014 (Lozier et al., 2019), and winter sinking in the Labrador Sea swings widely: it reached its deepest in the 1996–2023 record in 2018, then shut down in the winters of 2021 and 2023 (Yashayaev, 2024). Measurements also show that most of the overturning happens east of Greenland rather than in the Labrador Sea (Lozier et al., 2019), so those two winters do not by themselves mean the Atlantic circulation is weakening. The record is too short to say whether the real ocean is close to a threshold.
Climate models in which winter sinking collapses this century
Share of models
Model study Sgubin et al. (2017), Nature Communications; Swingedouw et al. (2021), Annals of the New York Academy of Sciences. “Most realistic”: closest to observed stratification; small samples.
What it would mean
Regional cooling within a decade
- 2–3°Ccooling around the North Atlantic in the models that show a collapse, within about ten years (Armstrong McKay et al., 2022).
- ~10 yearsfor the change to unfold, far faster than an Atlantic circulation collapse or ice-sheet loss.
- Rainfallshifts in the tropics, notably the Sahel and the Amazon, in the CMIP6 collapse events (Swingedouw et al., 2021).
A collapse would shift the jet stream and European weather. Recent cold anomalies in the gyre have been followed by summer heatwaves in central Europe, a statistical link rather than a rule (Duchez et al., 2016). Plankton, blue whiting and pilot whales have moved with past swings of the gyre (Hátún et al., 2009). The economic consequences of a collapse have not been quantified.
What can be done
Risk assessment, monitoring and emissions
Limit warming
Every tenth of a degree avoided lowers the chance of passing a threshold that may already be within reach. How much emissions must fall.
Count it in risk assessments
European and North Atlantic climate risk assessments, energy planning and fisheries management can test their plans against an abrupt regional cooling of several degrees.
Keep the observing arrays running
The OSNAP array has measured overturning here only since 2014. A gap now would be permanent. Ocean monitoring.
Link signals to decisions
Tie observations of winter sinking, salinity and overturning to agreed points at which plans are reviewed.
Which decisions should change
Act now
Long-lived, hard to reverse, and sensitive to the change: decide differently today.
- Commit long-term funding for observations in the subpolar North Atlantic (OSNAP, Argo, Labrador Sea surveys): a gap in the record cannot be filled later.
Assess now
High stakes but unclear answers: stress-test, monitor and set trigger points.
- Include abrupt regional cooling of several degrees in European and North Atlantic risk assessments.
- Test winter peak energy demand, heating standards and North Atlantic fisheries quota-setting against 2–3°C of regional cooling.
Stay the course
Pays off whatever happens, or is cheap to adjust later: keep going.
- Use decadal climate forecasts, which draw much of their skill from this region, in fisheries and seasonal energy planning.
The three decision types are Ocean Turning Points’ own lens, built on research on deciding under deep uncertainty. How to decide under uncertainty.
What this change means region by region and sector by sector
Sources
Sgubin et al. (2017), Nature Communications 8, 14375; Swingedouw et al. (2021), Annals of the New York Academy of Sciences 1504; Armstrong McKay et al. (2022), Science 377; Global Tipping Points Report 2025; Born & Stocker (2014), Journal of Physical Oceanography 44; Lozier et al. (2019), Science 363; Drijfhout et al. (2025), Environmental Research Letters, doi:10.1088/1748-9326/adfa3b; Yashayaev (2024), Communications Earth & Environment 5; Duchez et al. (2016), Environmental Research Letters 11; Hátún et al. (2009), Progress in Oceanography 80; Buckley & Marshall (2016), Reviews of Geophysics 54. Full evidence and references.