Which big ocean changes should the world plan for?
An independent guide to the big changes in the ocean, from a possible Atlantic circulation collapse to coral reefs passing a tipping point: how likely each is, what it would mean, and which decisions should change.
Ocean surface currents on 25 October, from NOAA satellite data. Imagery: NASA Blue Marble.
El Niño Advisory. Niño-3.4 sea temperatures are 3.4°C above normal (week of 21 October), the highest weekly value in NOAA’s record since 1981. Seasonal forecasts give months of warning of the droughts, floods and coral bleaching that El Niño brings.
The ocean nowSix big changes
They differ in how soon they arrive, how likely they are and what can be done about them.
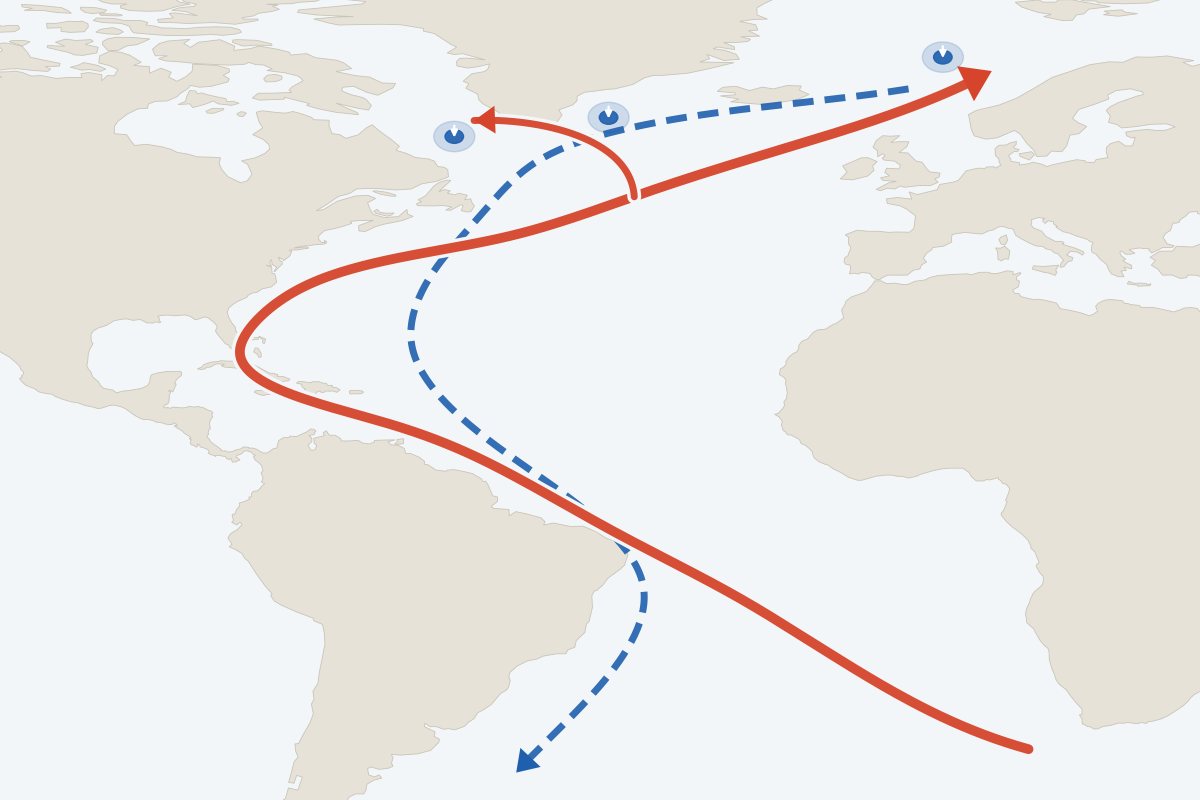 Weakening very likely; collapse possibleAtlantic circulation (AMOC)What would happen if the Atlantic circulation collapsed?
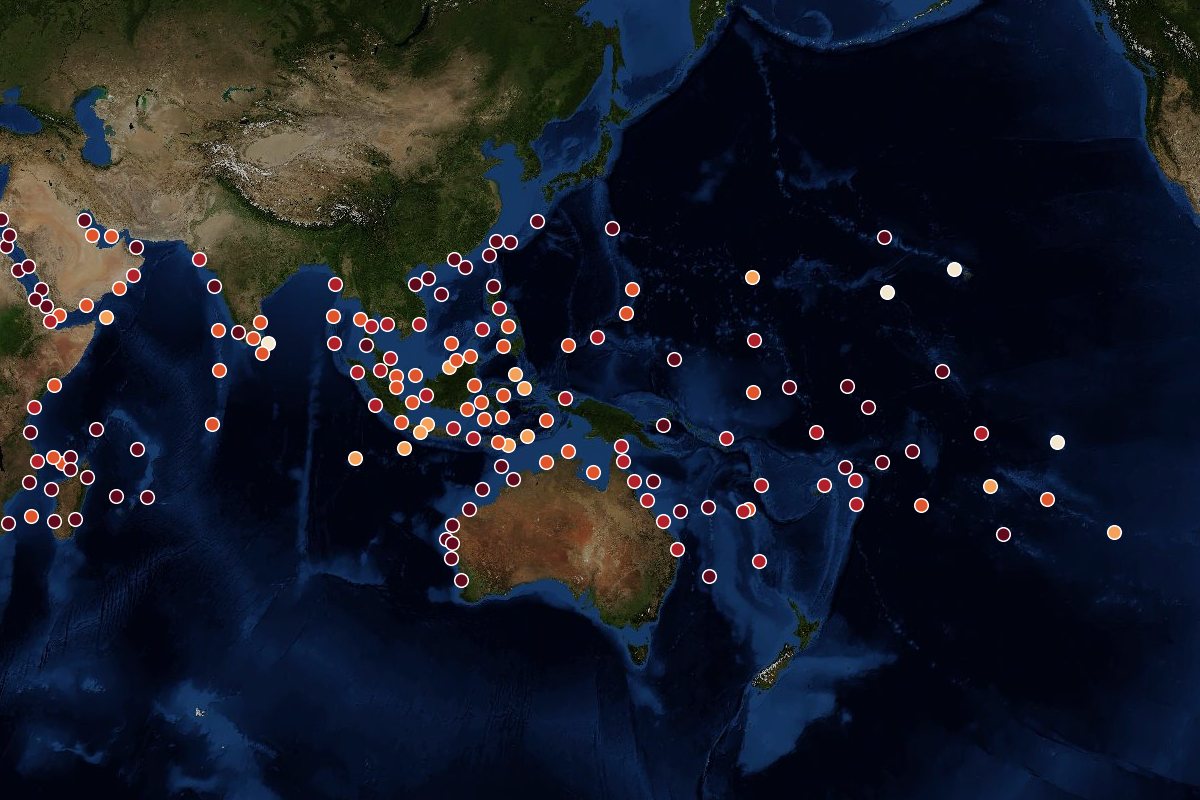 Tipping likely under wayCoral reefs and heat bleachingAre coral reefs passing a tipping point?
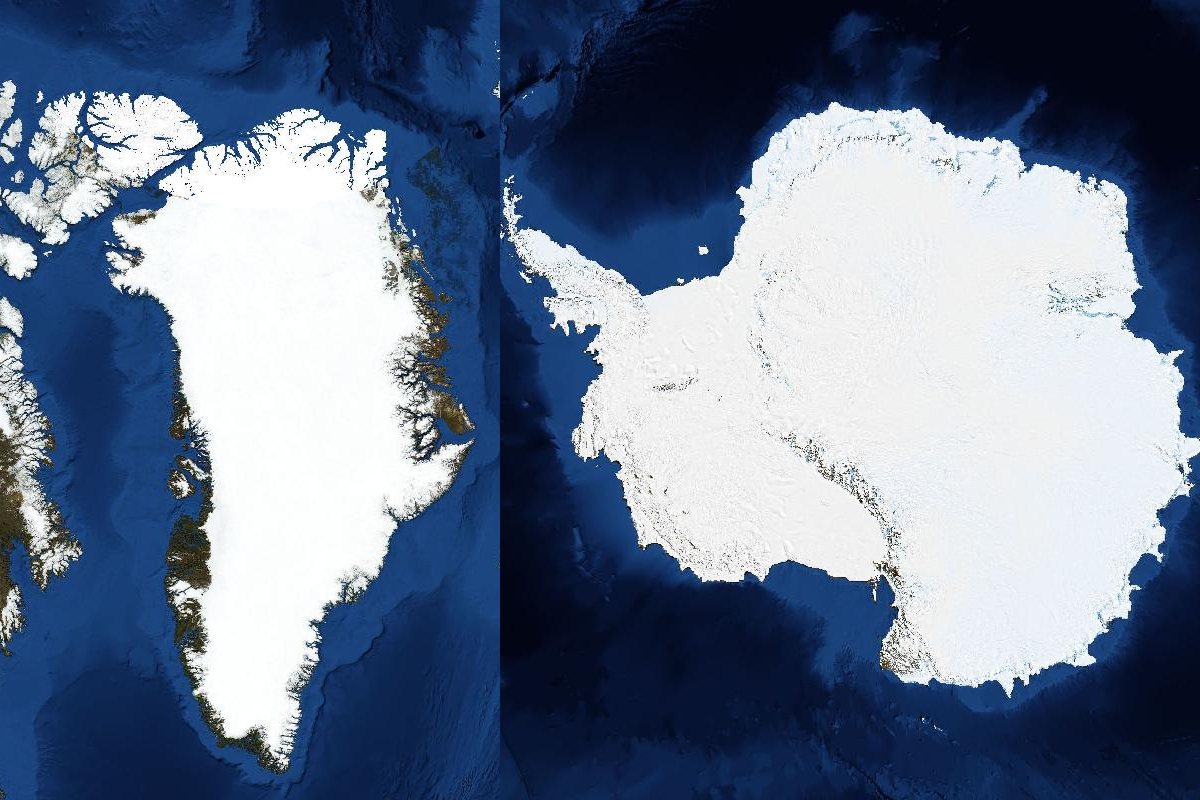 At risk since about 1°C of warmingIce sheets and sea-level riseWhat if the ice sheets pass their tipping points?
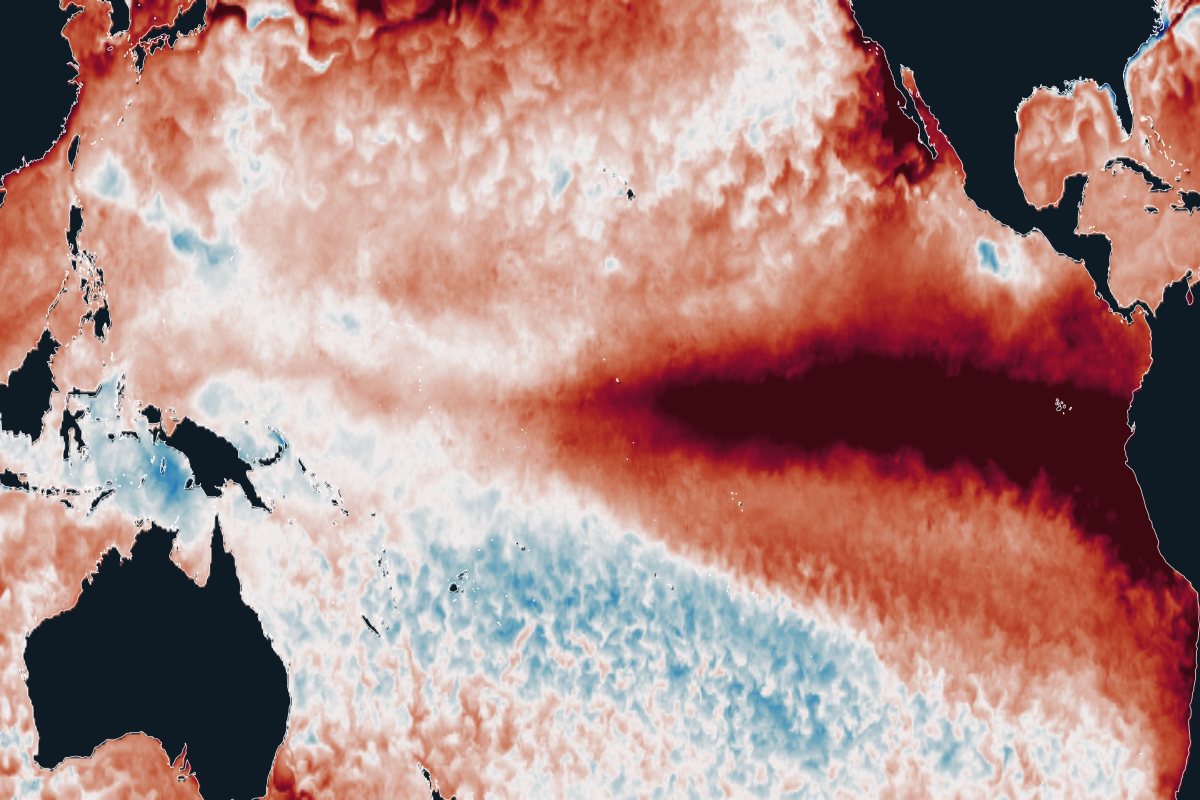 Strong El Niño now; extremes growingEl Niño and the tropical PacificHow is warming changing El Niño?
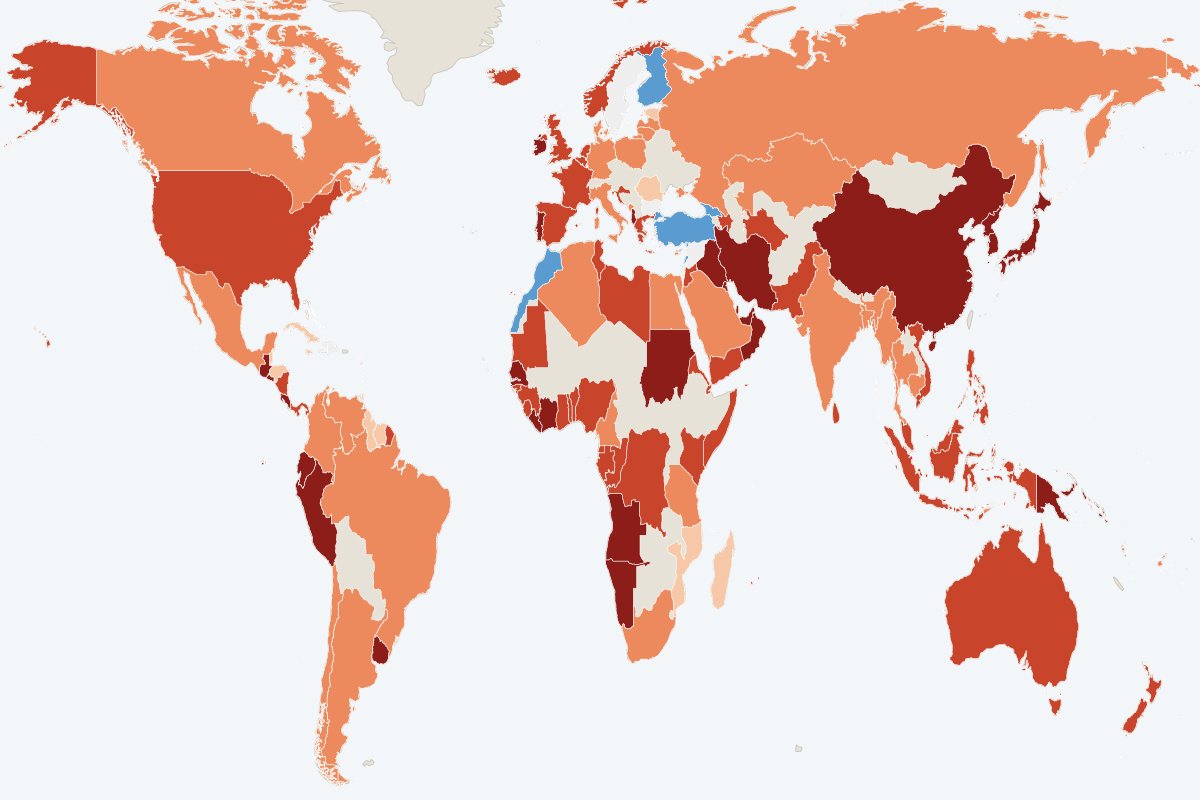 Under way; less fish with every degreeFish stocks on the moveWhere will the fish go?
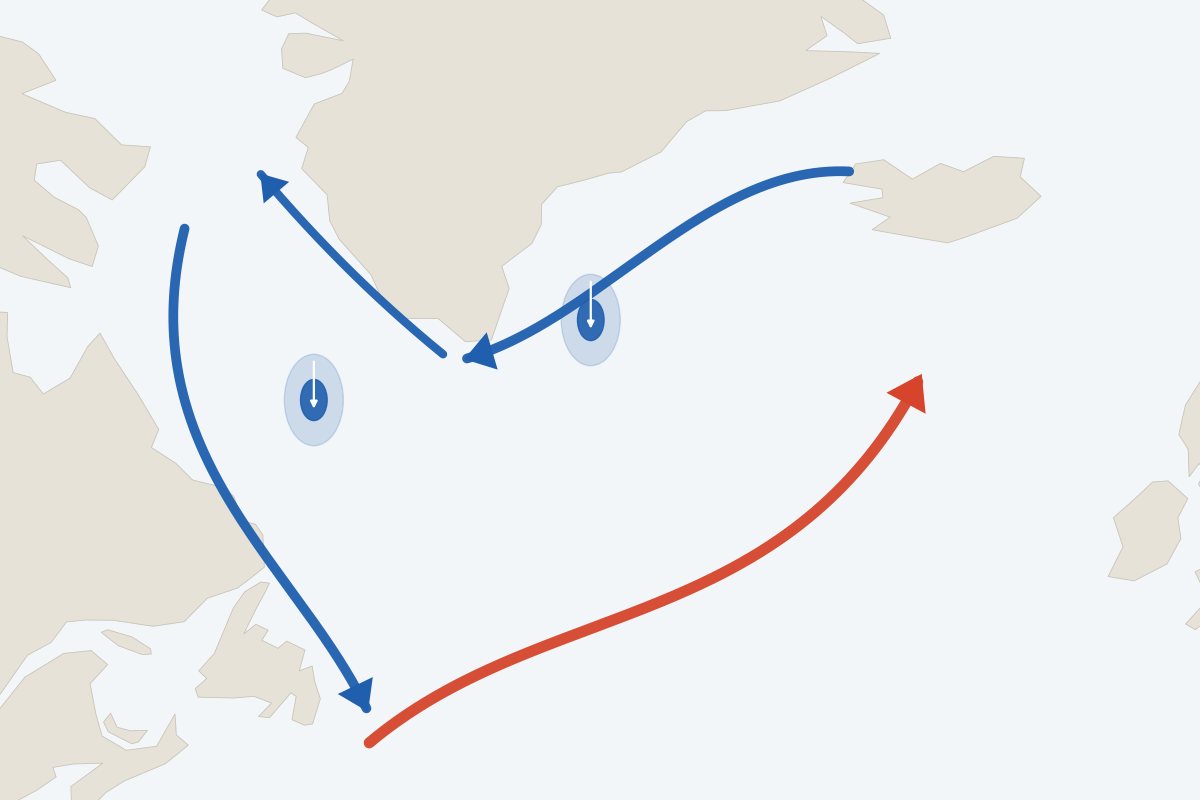 Possible this century; cooling within a decadeNorth Atlantic cooling (subpolar gyre)Could the North Atlantic cool abruptly?
Compare all six: what each is, how likely, what it would mean, what can be done
Atlantic circulation
What would happen if the Atlantic circulation collapsed?
The Atlantic Meridional Overturning Circulation is very likely to weaken this century. Whether it could collapse is disputed. Model experiments show what a collapse would do: much colder winters in northwest Europe and much less rain across the Sahel and South Asia.
- 1.9°C
- Average winter temperature in London in a world 2°C warmer with a collapsed circulation. In the same model’s pre-industrial climate it was 5.1°C.
- −29%
- Change in West African monsoon rainfall, average of four climate models (Ben-Yami et al., 2024). At Niamey, Niger, June–August rainfall falls by about 37%.
- −19%
- Change in Indian summer monsoon rainfall in the same four models. All four show drying; they differ on how much.
Temperature: one model (CESM), a world about 2°C warmer, several centuries after greenhouse gases stop rising. Rainfall: four models, the collapse alone with no added warming. Neither is a forecast.
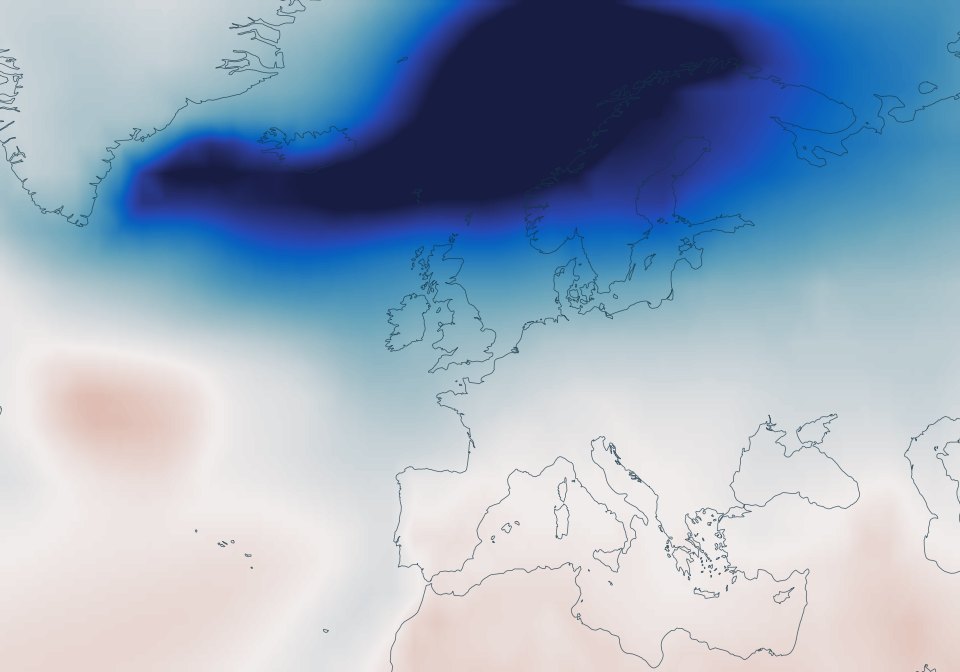
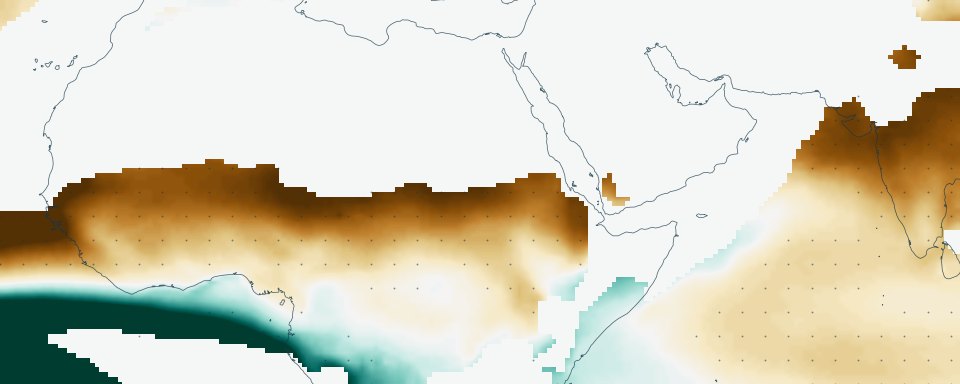 Top: winter temperature change (blue is colder). Bottom: summer rainfall change (brown is drier).
Recovery
Ocean life can come back
Where fishing stops and reefs are protected, fish and sharks return, often faster than expected. At Cabo Pulmo in Mexico, fish biomass rose more than fivefold in ten years after the community closed its reef to fishing.
Grey reef sharks over the reef in the south pass of Fakarava, French Polynesia.
From evidence to decisions
- The future oceanWhat is already expected, and three futures at 1.5, 2.7 and 4°C.
- Impacts in your regionFood, water, coasts, fisheries and public finance in thirteen regions.
- How to decideWhich decisions to change now, which to assess and which are robust.
- What can be doneHow far emissions must fall, protecting the ocean, and paying for it.
- Who is watching the oceanEvery observing platform on one map, and why long records matter.
- Latest researchNew studies on the big changes, with plain summaries.
How we work
Published evidence only
Every map, chart and statement comes from peer-reviewed research or an official dataset, cited where it is used.
Measurements and models labelled
Observations are marked as observed. Model experiments are marked as experiments, and never presented as forecasts.
Uncertainty shown
Where models disagree, each one is shown. Where the evidence is thin, the text says so.
Reviewed and dated
Every topic shows when it was last checked against new research.