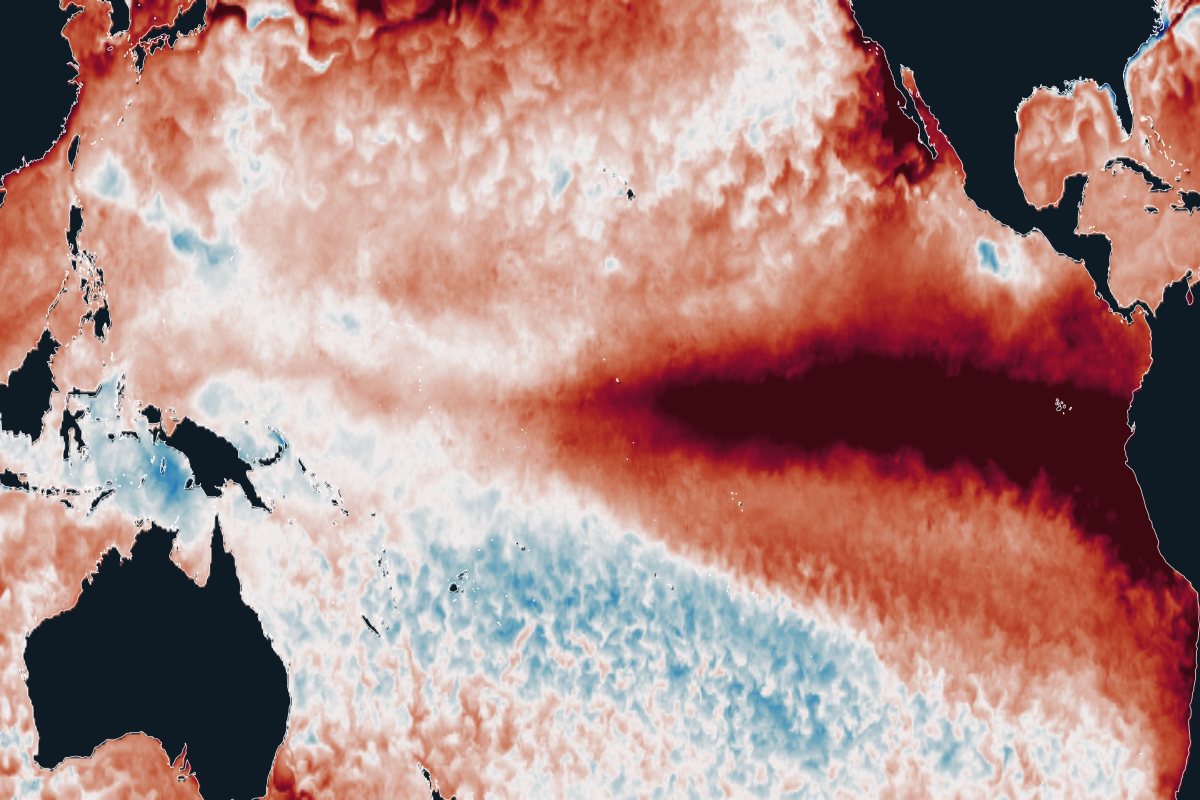
A strong El Niño is under way in 2026. The bigger question is what warming does to it: new research finds the Pacific can stay in a more El Niño-like state for centuries after net zero, with more frequent extremes.
- What is it?
- A natural warming of the eastern tropical Pacific every few years that shifts rain and drought around the world.
- How likely is it?
- El Niño will keep coming. Stronger extremes are expected (medium confidence); a lasting El Niño-like Pacific is plausible but contested.
- What would it mean?
- Droughts, floods, food shortages and disease outbreaks, with economic losses that last for years, mostly in tropical countries.
- What can be done?
- Act on forecasts with pre-arranged finance; size reserves and insurance for stronger events; earlier net zero limits the long-term shift.
Observations, updated dailyModel projectionsReviewed 25 October 2026
The 2026 event
One of the strongest El Niños on record
- NOAA status
- El Niño Advisory
- Central Pacific (Niño-3.4) compared with normal, week of 21 October 2026
- +3.4°C
- Minus the warming of the whole tropics (relative index)
- +2.5°C
- Three-month relative index (JAS 2026)
- +1.69°C
The central Pacific is +3.4°C warmer than normal, the highest weekly value since NOAA’s record began in 1981. On 21 October the World Meteorological Organization forecast about +3.8°C for November to January. Western South America has already had severe flooding.
FEWS NET, the food-security early warning network, rates its concern as high for Southern Africa and much of East Africa. It expects food insecurity to peak in Southern Africa between late 2027 and early 2028, well after the event itself.
Hover or tap the chart to read weekly values.
Observed NOAA Climate Prediction Center, OISST v2.1, 1991–2020 normal.
Sources: WMO Global Seasonal Climate Update, 21 October 2026; WMO update, 22 October 2026; FEWS NET special report on 2026–27 El Niño food security impacts, 6 October 2026. Event figures will change as the season develops.
The latest research
A more El Niño-like Pacific after net zero
In a normal year the western Pacific is much warmer than the east, and that contrast drives the trade winds. During El Niño the contrast weakens. Most climate models project that warming slowly weakens it for good, giving a Pacific that is more El Niño-like on average.
Sengupta and colleagues (2026) asked what happens after emissions stop. In nine Earth system models, the contrast did not recover after net zero; in eight of the nine it kept weakening. The share of El Niño events that are extreme roughly doubled and stayed doubled.
In 1,000-year runs of one model, the later net zero is reached, the larger and longer-lasting the effect. Reaching net zero in 2030, 2045 or 2060 corresponds to long-run warming of about 1.3, 2.0 and 3.0°C in that model.
Why the shift persists:
- The Southern Ocean and deep ocean keep warming after emissions stop.
- The rain belts near the equator shift, and the southern trade winds weaken and stay weak.
- Less cold water rises along the equator in the east, so the east–west contrast stays weak.
Nine Earth system models (ZECMIP)
One model, net zero reached at different dates (ACCESS-ESM1-5)
Extremes
Projected changes in El Niño extremes
- 1 in 20 → 1 in 10 years
Extreme El Niños that move the Pacific rain belt east, in 20 climate models, this century compared with last.
Cai et al. (2014), Nature Climate Change - ×2 at 1.5°C
Extreme El Niño frequency doubles by 1.5°C of warming and keeps rising for up to a century after temperatures stabilise.
Wang et al. (2017), Nature Climate Change - 1 in 23 → 1 in 13 years
Extreme La Niña under high emissions, most often in the year after an extreme El Niño: sharper swings from flood to drought.
Cai et al. (2015), Nature Climate Change - +12% to +16%
Larger year-to-year sea temperature swings this century, in about nine in ten of the latest models, under low and very high emissions.
Cai et al. (2022), Nature Climate Change - 1,000 years
Galápagos corals show that recent eastern Pacific El Niños are stronger than at any time in the past millennium.
Cole et al. (2026), Science - Very likely
The IPCC judges that El Niño-related rainfall swings will grow in the second half of this century under intermediate and high emissions.
IPCC AR6 Working Group I (2021)
These studies measure different things (event frequency, share of events, temperature variability, coral records), so the numbers are not directly comparable.
How sure
Observations and models disagree
Since about 1950 the east–west contrast has strengthened, which is more La Niña-like, while most models simulate the opposite. Several studies find this is unlikely to be natural variability alone (Seager et al., 2019, 2022; Sugiura et al., 2026). One synthesis argues that the processes behind the recent trend will give way to weakening ones, but that firm evidence is not yet available (Watanabe et al., 2024).
The two observations can both hold: individual El Niño events have grown stronger even as the average state moved La Niña-like. El Niño is not assessed as a tipping system (Global Tipping Points Report 2025). The single model behind the long net-zero runs has biases that, its authors note, could inflate the number of extreme events.
Australia
Australia: drought and fire weather
El Niño, especially together with a positive Indian Ocean Dipole, is the main driver of drought years and extreme fire weather in eastern Australia (Harris and Lucas, 2019). Droughts break when La Niña returns, so a Pacific that spends less time in La Niña-like states matters as much as El Niño itself (King et al., 2020).
The 2019 combination of drought and fire weather before the Black Summer fires had about a 1-in-200 chance in today’s climate, and losses were estimated at over A$100 billion (Squire et al., 2021). That season, record swings in the Indian Ocean Dipole and the Southern Annular Mode drove more than half of the drought (van Oldenborgh et al., 2021). Fire weather and burned forest area are trending up (Canadell et al., 2021).
Sengupta and colleagues detect lasting rainfall changes over Australia linked to the El Niño-like state, but give no figures and call for more work. No study yet puts a number on how much drier Australia would be under a lasting El Niño-like Pacific. Climate conditions since 2000 have already cut average farm profits by about 22% compared with the 1950–2000 climate (Hughes et al., 2022). Australian wheat production averages about 15% below normal in strong El Niño years (FEWS NET, 2026).
Share of winter–spring seasons in drought, 2010–2099, high emissions
Consequences
Why this matters for development
- US$5.7 trillionglobal income lost after the 1997–98 El Niño, with growth held back for years; the hardest-hit countries are mostly lower-income and tropical (Callahan and Mankin, 2023).
- 6 millionadditional children underweight during the 2015 El Niño, across 51 countries (Anttila-Hughes et al., 2021).
- 9.6 millionadditional dengue cases linked to the 2023–24 El Niño, across 57 countries (Tian et al., 2025).
Economic losses grow faster than El Niño strength: in one estimate, losses rise exponentially with larger swings (Liu et al., 2023). El Niño can also cause crop failures in several breadbaskets at once (Anderson et al., 2019).
What decision-makers can do
Forecast-based action and long-term planning
Act on the forecast
El Niño is the most predictable large climate hazard, often months ahead. Agree trigger levels, actions and pre-arranged finance in advance, so money moves when the forecast crosses the trigger rather than after the losses (Coughlan de Perez et al., 2015). Less than 1% of humanitarian funding currently goes to anticipatory action (UN, 2026).
Size buffers for bigger events
Food reserves, water storage, insurance and contingent credit sized on past El Niños may fall short if extremes become twice as common. Losses also persist for years, so recovery support should too.
Do not plan on the old normal
Dams, irrigation, hydropower and fisheries management in El Niño-sensitive regions should be tested against a Pacific that spends more time in El Niño-like states. If it happens, the shift lasts for centuries.
Earlier net zero limits the shift
In the model runs, each delay in reaching net zero made the El Niño-like state stronger and longer-lasting. Emission cuts are the only lever on the long-term change. How much emissions must fall.
Which decisions should change
Act now
Long-lived, hard to reverse, and sensitive to the change: decide differently today.
- Agree forecast triggers, actions and pre-arranged finance before the next event, where they do not yet exist.
Assess now
High stakes but unclear answers: stress-test, monitor and set trigger points.
- Test reservoir operating rules, food reserves, insurance and fisheries management against stronger and more frequent extreme events.
Stay the course
Pays off whatever happens, or is cheap to adjust later: keep going.
- Seasonal forecasts, early warning, forecast-based finance and social protection: proven tools that work under any El Niño future.
The three decision types are Ocean Turning Points’ own lens, built on research on deciding under deep uncertainty. How to decide under uncertainty.
What this change means region by region and sector by sector
About these data and sources
Globe: sea-surface temperature compared with the 1985–2012 normal, NOAA Coral Reef Watch, updated daily. Indices: NOAA Climate Prediction Center weekly Niño indices and Relative Oceanic Niño Index; status from the ENSO diagnostic discussion of 8 October 2026.
Research: Sengupta, A. et al. (2026) Ocean thermal inertia sustains a tropical Pacific mean state shift under net zero. Communications Earth & Environment 7, 810 (numbers transcribed, chart redrawn). Cai, W. et al. (2014, 2015, 2022), Nature Climate Change. Wang, G. et al. (2017), Nature Climate Change. Cole, J. E. et al. (2026), Science. Watanabe, M. et al. (2024), Nature. Seager, R. et al. (2019), Nature Climate Change.
Australia: Delage & Power (2020), Climate Dynamics; King et al. (2020), Nature Climate Change; Harris & Lucas (2019), PLOS ONE; Squire et al. (2021), npj Climate and Atmospheric Science; van Oldenborgh et al. (2021), Natural Hazards and Earth System Sciences; Canadell et al. (2021), Nature Communications; Hughes et al. (2022), Climatic Change.
Impacts: Callahan & Mankin (2023), Science; Anttila-Hughes et al. (2021) and Tian et al. (2025), Nature Communications; Liu et al. (2023), Nature Communications; Anderson et al. (2019), Science Advances. Coughlan de Perez et al. (2015), Natural Hazards and Earth System Sciences, is co-authored by the curator of Ocean Turning Points.