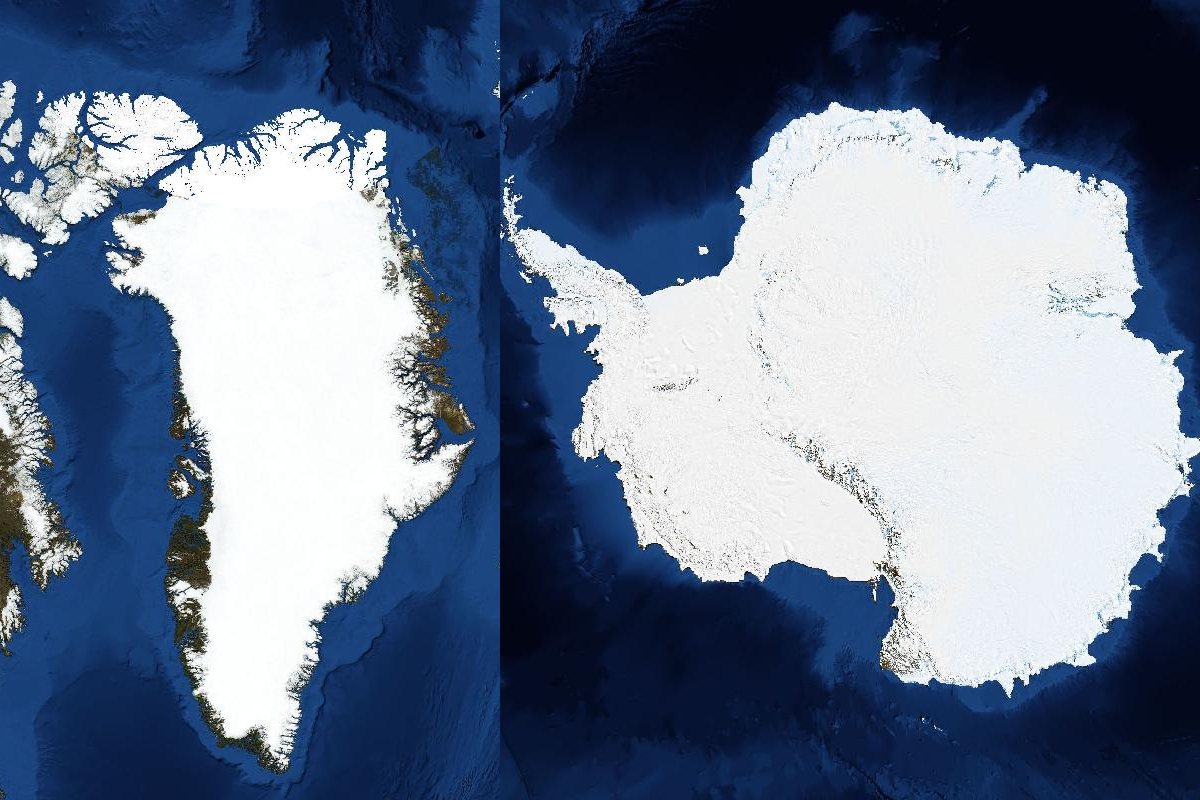
The Global Tipping Points Report 2025 has high confidence that the Greenland and West Antarctic ice sheets have tipping points, and finds them at risk since about 1°C of warming. Parts may already have crossed. Tipping would not flood coasts overnight. It would lock in metres of sea-level rise over centuries to millennia, at a pace that is still uncertain.
- What is it?
- Greenland and Antarctica hold enough ice to raise the sea by about 65 m. Past a threshold, feedbacks keep an ice sheet shrinking even if warming stops.
- How likely is it?
- High confidence that both have tipping points, at risk since about 1°C of warming; whether parts of West Antarctica have already passed one is disputed.
- What would it mean?
- Metres of sea-level rise locked in over centuries to millennia. How fast it comes is the main uncertainty for coastal cities, deltas and islands.
- What can be done?
- Keep peak warming as low as possible and bring it back towards 1°C; plan ports, defences and new districts for a high-end rise.
The stakes
Long-term sea-level rise by peak warming
Ice sheets respond slowly, so today’s warming will play out over centuries. The IPCC estimates that over the next 2,000 years sea level will rise by about 2–3 m if warming is limited to 1.5°C, 2–6 m if it is limited to 2°C, and 19–22 m at 5°C (low confidence). The commitment rises steeply with peak warming: about 2–3 m at 1.5°C, but 19–22 m at 5°C.
Tipping points are why. Past a threshold, feedbacks keep the ice retreating even if warming stops: a thinning Greenland surface sits in warmer air, and West Antarctic glaciers resting on bedrock below sea level retreat into ever deeper water.
- 7.4 mof sea level held in the Greenland ice sheet (Morlighem et al., 2017)
- 3.3 min the part of West Antarctica most prone to runaway retreat (Bamber et al., 2009)
- 58 min the whole Antarctic ice sheet (Fretwell et al., 2013)
Eventual sea-level rise, by the peak warming the world reaches
Metres of global rise, as ranges
- Within 2,000 years
- Within 10,000 years
Thresholds
Thresholds and evidence of crossing
The Global Tipping Points Report 2025 puts the threshold for Greenland at 0.8–3.4°C of warming and for West Antarctica at 1–3°C. Today’s warming is about 1.4°C, inside both ranges.
Once lost, the ice does not come back on any timescale that matters to people. In one model, West Antarctica only regrows once temperatures fall at least 1°C below pre-industrial (Garbe et al., 2020).
| Assessment | Finding |
|---|---|
| IPCC (2021)Assessment | Changes in the Amundsen Sea are “compatible with, but not unequivocally indicating” runaway retreat (medium confidence). |
| Hill et al. (2023)Three ice-sheet models | No sign yet of self-sustaining retreat; today’s retreat is driven by ocean warming. |
| Reese et al. (2023)Ice-sheet model | Irreversible retreat under today’s climate cannot be excluded, but is not yet inevitable. |
| Bett et al. (2024)Coupled ice–ocean model | Thwaites Glacier retreats even with no ocean melting: a tipping point may have been passed. |
| van den Akker et al. (2025)Model ensemble | If today’s climate persists, Thwaites and Pine Island glaciers collapse in every run, over several centuries. |
| Global Tipping Points Report (2025)Synthesis | Parts of the polar ice sheets may already have crossed tipping points. |
What we observe
Ice loss has quadrupled since the 1990s
Satellites show the two ice sheets lost about 11,300 billion tonnes of ice between 1979 and 2023 (Otosaka et al., 2026), adding 28 mm to sea level since 1992. The rate of loss rose fourfold between the 1990s and the 2010s (IPCC, 2021).
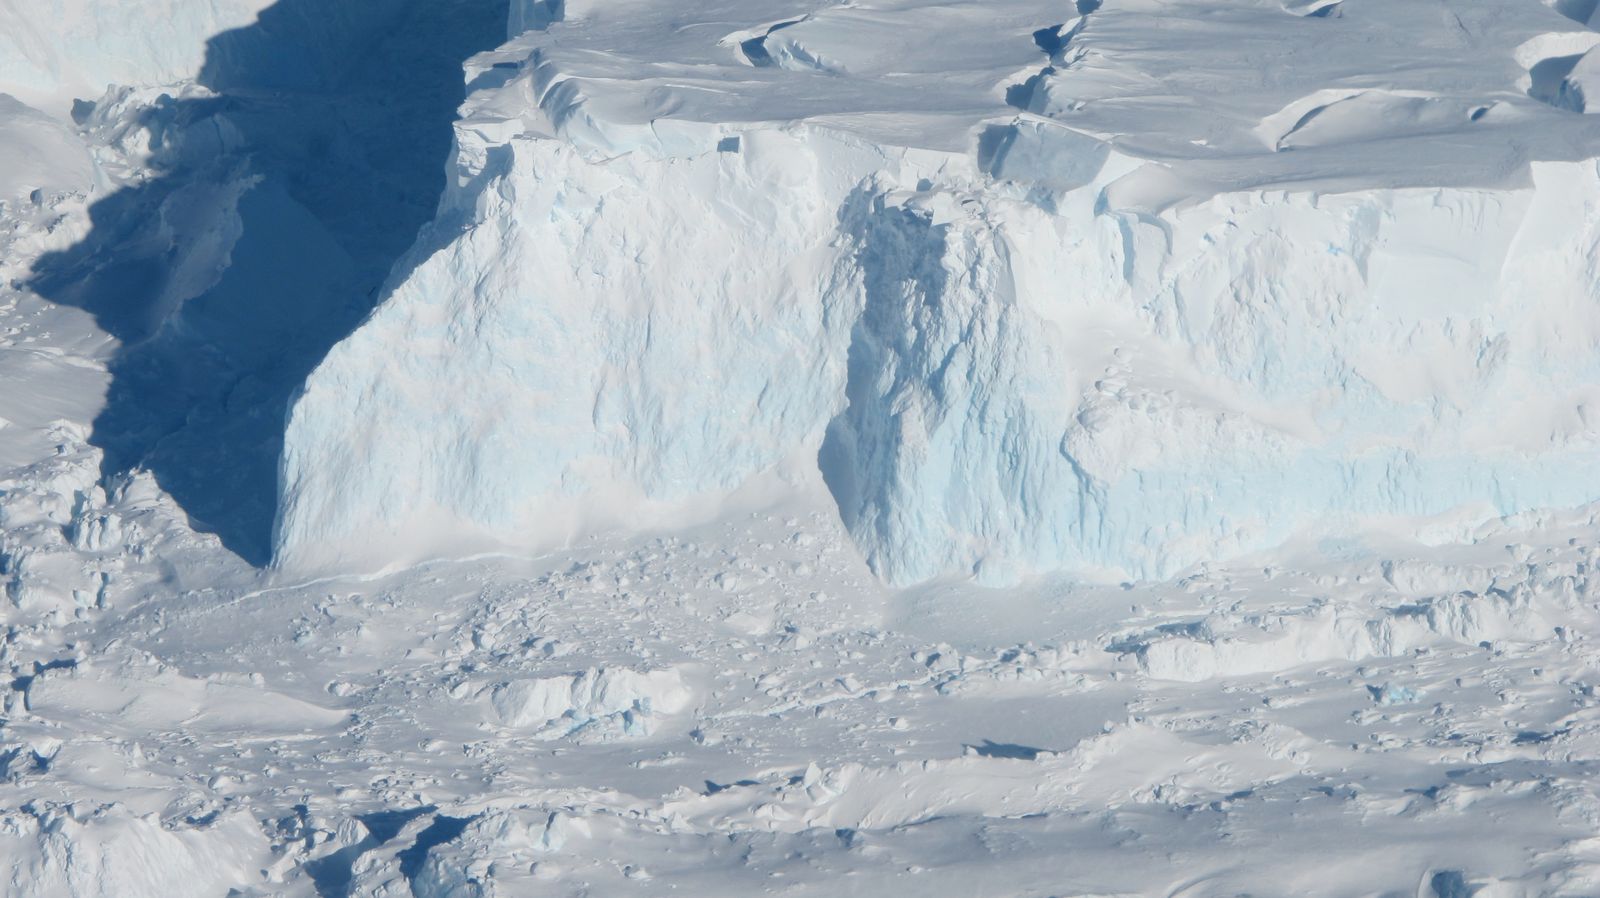
In West Antarctica, loss from Thwaites Glacier has increased more than fivefold since the 1990s, and the pattern of thinning suggests possible runaway retreat (Goldberg et al., 2026). The ice shelf in front of Pine Island Glacier has lost almost all of the resistance that holds the glacier back (Wells-Moran et al., 2026). Signs of faster Antarctic loss could become visible within a few decades (IPCC, 2021).
Together 28 mm by the end of 2023.
Source: Otosaka et al. (2026), Scientific Data, doi:10.1038/s41597-026-08088-0; data UK Polar Data Centre, Open Government Licence v3.0. Rebased to January 1992.
How fast
Projections to 2300
The IPCC’s likely range for 2100 is 0.28–0.55 m under very low emissions and 0.63–1.01 m under very high emissions. Under very high emissions it cannot rule out a rise approaching 2 m by 2100 and 5 m by 2150, because of ice-sheet processes it cannot yet model with confidence.
Projections that include those processes reach a median of 5.2 m by 2300 under very high emissions, and up to about 16 m. Under low emissions (SSP1-2.6) the median is 1.6 m. The fastest scenarios rely on ice cliffs collapsing under their own weight, a process that has not been observed and is disputed (Edwards et al., 2019; Morlighem et al., 2024). It affects how fast the sea rises and makes little difference to how far it eventually goes.
The gap between the two scenarios widens for centuries.
Source: IPCC AR6 (Fox-Kemper et al., 2021), low- and medium-confidence projections; Garner et al. (2021), doi:10.5281/zenodo.6382554, CC BY 4.0. The IPCC could not assess the likelihood of the rapid ice-loss processes.
The coasts
What ice-sheet loss would mean for exposed cities
Ice lost from Antarctica raises the sea most far from Antarctica, including in the tropics, because the ice sheet’s gravity no longer pulls water towards it (Mitrovica et al., 2009). Many of the most exposed cities are also sinking.
How much higher could the sea be if the ice sheets give way faster than expected? For each city, the bars show the likely range under moderate and very high emissions, and the range with rapid ice-sheet loss, which the IPCC cannot rule out.
- Moderate emissions the range most plans use
- Very high emissions likely range
- Very high emissions with rapid ice-sheet loss cannot be ruled out
Bars: 17th to 83rd percentile; tick: median. Right-hand number: upper end with rapid ice-sheet loss, in metres. Sorted by that value. Select a city for its full projection.


What decision-makers can do
Planning for high-end sea-level rise
Keep peak warming as low as possible
The commitment is set by how high warming peaks and how long it stays there. Ice sheets respond slowly, so a short overshoot of 1.5°C may not tip them, but the safe long-term level is likely closer to 1°C (Stokes et al., 2025). A recent review calls for warming to peak below 2°C, return below 1.5°C within this century and to about 1°C thereafter (Ritchie et al., 2026). How much emissions must fall.
Test long-lived assets against a high-end rise
Ports, power plants, airports, delta polders and new urban districts will stand beyond 2100. A single best estimate is the wrong basis for them: decision-makers should use high-end scenarios matched to how much risk they can tolerate (Hinkel et al., 2019). Only 13% of practitioners surveyed consider a high-end scenario, and use of projections is lower in developing countries (Hirschfeld et al., 2023).
Keep options open and set triggers
Adaptive pathways plan a sequence of measures, with agreed sea levels or Antarctic signals at which to switch, and avoid building what cannot later be raised or moved. Seawalls without a long-term plan can lock in exposure (IPCC, 2022).
Face the adaptation commitment early
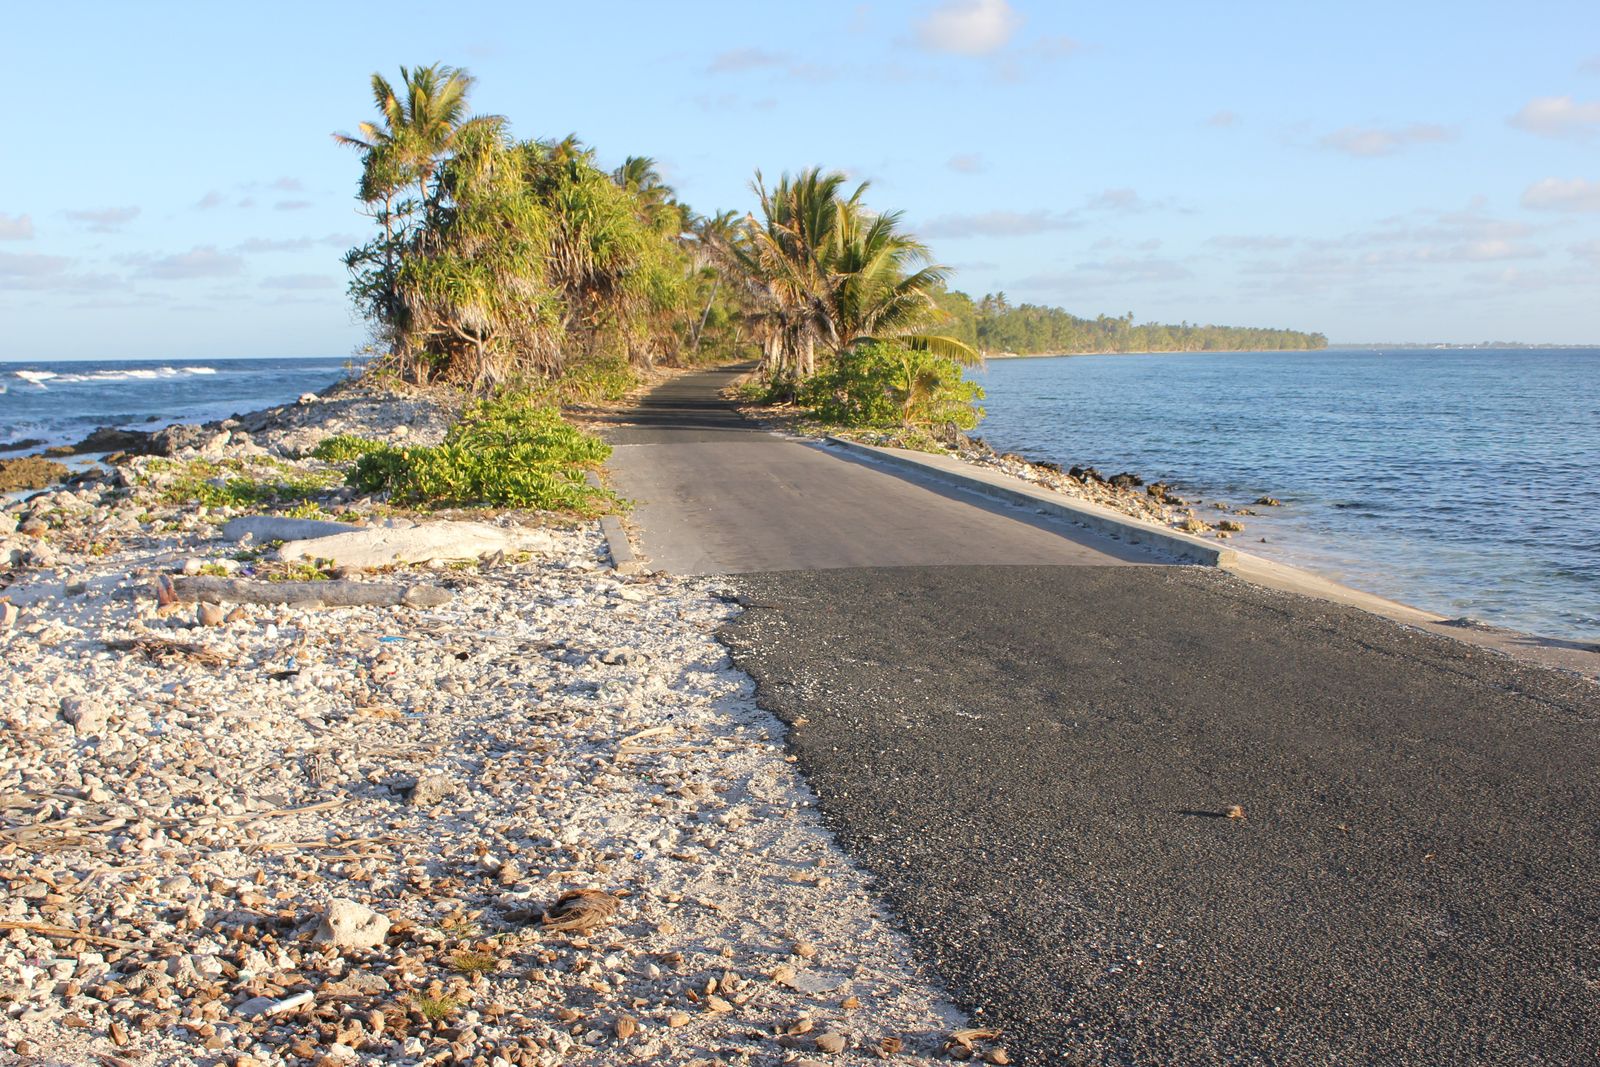
Ignoring rise beyond 2100 creates a commitment gap that leads to costly retrofits and stranded assets (Haasnoot et al., 2021). Atoll islands and tropical deltas will reach limits to adaptation first (Magnan et al., 2022), and some may need planned relocation.
The Netherlands tests its delta plan against Antarctica
Dutch planners re-examined their coastal strategy against fast Antarctic ice-loss storylines. Sand nourishment could need to be up to 20 times larger than today by 2100, storm-surge barriers would close more often until they closed permanently, and the expected lifetime of investments would shrink drastically (Haasnoot et al., 2020).
Exposure doubles at 0.75 m
Without further adaptation, the number of people exposed to a 1-in-100-year coastal flood roughly doubles with 0.75 m of rise above 2020 and triples at 1.4 m (IPCC, 2022). Under a high-end scenario, 0.75 m could arrive around 2080 (Haasnoot et al., 2021). The IPCC finds sea-level rise an existential threat for some small islands and low-lying coasts.
Which decisions should change
Act now
Long-lived, hard to reverse, and sensitive to the change: decide differently today.
- Avoid new development in low-lying land that will be exposed later this century; setback zones for new building are cheap now and costly later.
- Build seawalls only as part of a long-term adaptive plan, so they do not lock people into rising risk.
- Start the long lead-time work, on land, finance and consent, where pathways show relocation may be needed.
Assess now
High stakes but unclear answers: stress-test, monitor and set trigger points.
- Find when current coastal strategies stop working, and test them against high-end sea-level rise.
- Monitor sea-level rise and Antarctic signals, with decision points that move earlier if the rise speeds up.
- Use upper-bound sea levels for decisions that are long-lived, critical and hard to reverse.
Stay the course
Pays off whatever happens, or is cheap to adjust later: keep going.
- Near-term protection, flood-proofing, early warning and beach nourishment to about 2050: sea level by mid-century differs little between emissions scenarios.
The three decision types are Ocean Turning Points’ own lens, built on research on deciding under deep uncertainty. How to decide under uncertainty.
What this change means region by region and sector by sector
About these data and sources
Projections: IPCC AR6 sea-level projections (Garner et al., 2021, doi:10.5281/zenodo.6382554, CC BY 4.0; method Kopp et al., 2023), relative to 1995–2014. City values are at the nearest suitable tide gauge or 1° grid cell, and include vertical land motion estimated from tide gauges but not present-day subsidence that no gauge records. The rapid ice-loss values are the IPCC’s low-confidence projections, which include marine ice-cliff instability; the IPCC could not assess their likelihood. Commitment: IPCC AR6 WGI Table 9.10 (Fox-Kemper et al., 2021). Ice sheets: IMBIE (Otosaka et al., 2026, doi:10.1038/s41597-026-08088-0), Open Government Licence. Thresholds: Armstrong McKay et al. (2022) as updated by the Global Tipping Points Report 2025.
Studies: Hill et al. (2023) and Reese et al. (2023), The Cryosphere 17; Bett et al. (2024), The Cryosphere 18; van den Akker et al. (2025), The Cryosphere 19; Garbe et al. (2020), Nature 585; Goldberg et al. (2026), Geophysical Research Letters 53; Wells-Moran et al. (2026), PNAS 123; Edwards et al. (2019), Nature 566; Morlighem et al. (2024), Science Advances 10; Stokes et al. (2025), Communications Earth & Environment 6; Ritchie et al. (2026), Environmental Research Letters 21; Hinkel et al. (2019), Earth’s Future 7; Hirschfeld et al. (2023), Communications Earth & Environment 4; Haasnoot et al. (2020), Environmental Research Letters 15; Haasnoot et al. (2021), Climate Risk Management 34; Magnan et al. (2022), Scientific Reports 12; Mitrovica et al. (2009), Science 323; Morlighem et al. (2017), Geophysical Research Letters 44; Bamber et al. (2009), Science 324; Fretwell et al. (2013), The Cryosphere 7. Full evidence and references.