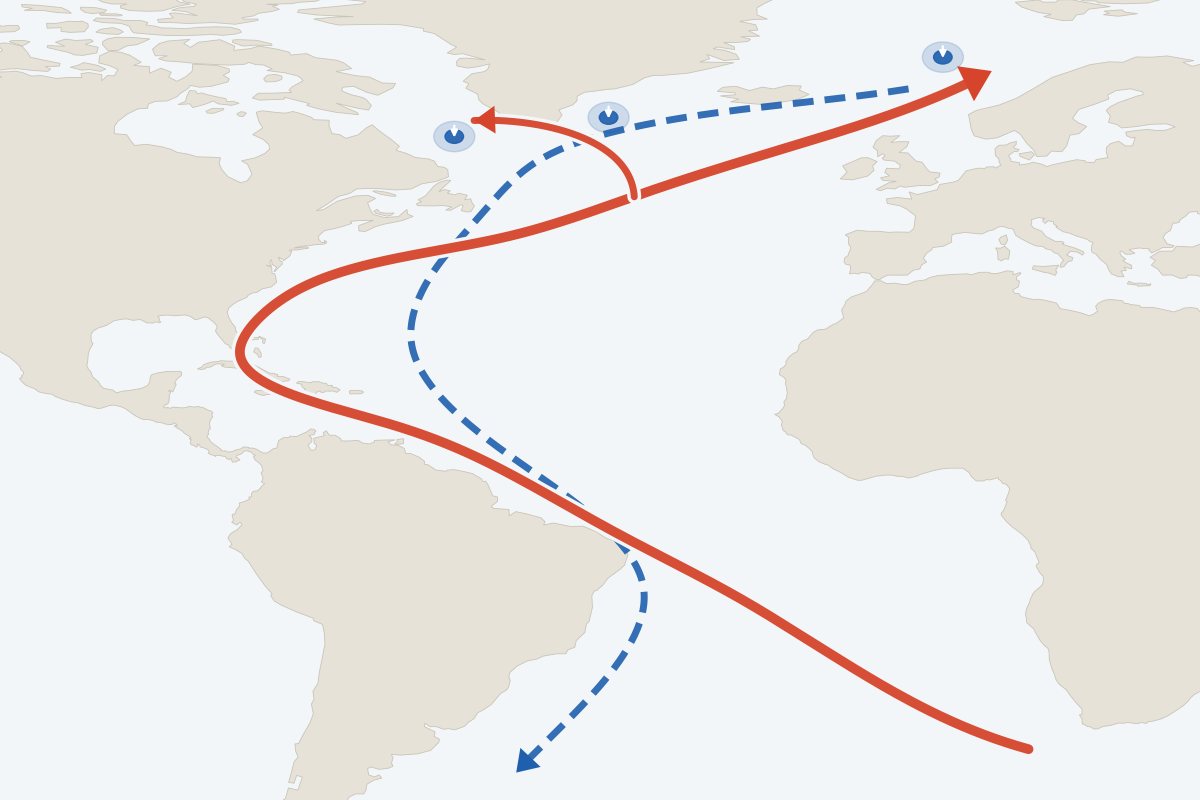
The Atlantic Meridional Overturning Circulation (AMOC) moves heat around the planet. If it collapsed, the effects would be large and would last for centuries, for Europe and for hundreds of millions of people who depend on tropical monsoons.
- What is it?
- A system of Atlantic currents that carries warm water north and cold water back south at depth. It keeps northwest Europe mild and holds the tropical rain belts in place.
- How likely is it?
- Weakening this century is very likely. A collapse is a low-likelihood, high-impact risk: the IPCC has medium confidence it will not happen before 2100, and newer studies disagree.
- What would it mean?
- Much colder winters in northwest Europe, weaker monsoons in West Africa and South Asia, and faster sea-level rise on North Atlantic coasts, for centuries.
- What can be done?
- Limit both the amount and the speed of warming; test long-lived investments against a collapse and favour measures that help either way.
Model experimentsObservations to 2024Reviewed 24 October 2026
What it is
How the Atlantic circulation works
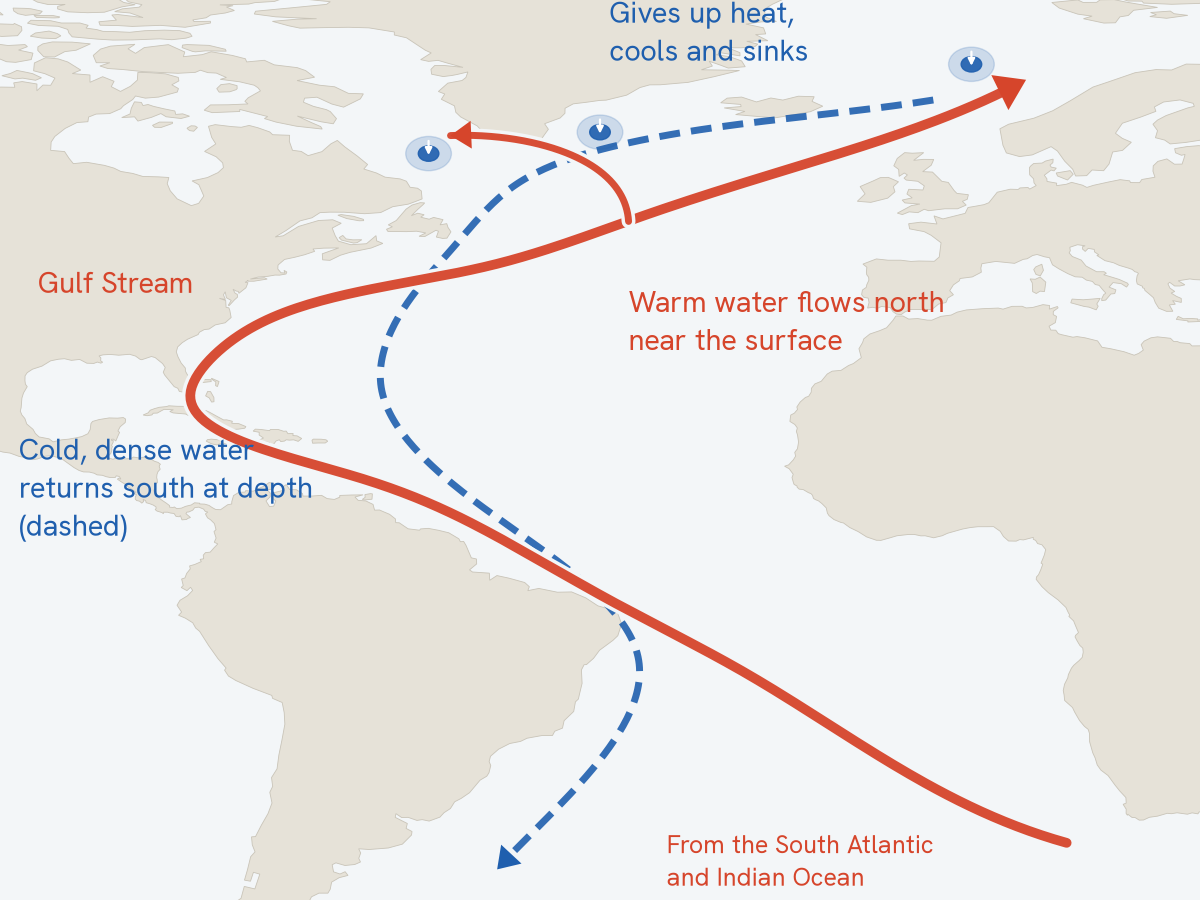
Warm, salty water flows north near the surface of the Atlantic, through the Gulf Stream and on towards Greenland and Norway. There it gives up its heat to the air, becomes cold and dense, and sinks. It returns south at depth and spreads through the world ocean. Measured at 26.5°N, the circulation moves about 17 million cubic metres of water a second.
The heat it releases keeps northwest Europe milder than other places at the same latitude. It also helps hold the tropical rain belt north of the equator, where the West African and South Asian monsoons depend on it, and it shapes sea level on North Atlantic coasts (Weijer et al., 2019).
Two things are often confused. Weakening is gradual, and the IPCC judges it very likely this century under every emissions scenario. Collapse is a tipping point: the circulation falls into a much weaker state and stays there for centuries. The maps below show what a collapse would do; how likely it is comes further down.
The address keeps the map, measure and region you chose.
Reading these maps
These are experiments
The maps show the climate a model settles into once its AMOC has collapsed. The temperature maps show the years 2400–2499, in runs where greenhouse gases stop rising in 2100. Modellers trigger the collapse by adding fresh water to the North Atlantic. The results show what a collapse would do. They say nothing about when, or whether, one will happen.
Collapse alone, or collapse plus warming
Temperature comes from one model, run in five different states. Some comparisons isolate the collapse. Others show the total change since pre-industrial times, combining the cooling with greenhouse warming. Comparisons marked “note” mix two model set-ups; the note under the map explains how.
Where models agree
Rainfall is the average of 4 independent models. Dots mark places where all of them agree on whether it gets wetter or drier. The table under the map lists each model’s value, so the range is visible.
Consequences
What would a collapse mean where people live?
Europe’s cooling gets most of the attention. Many more people would be affected by changes in rainfall, as the tropical rain belt shifts south and the monsoons of the Northern Hemisphere weaken.
Northwest Europe
1.9 °C
Average winter temperature in London in a world about 2 °C warmer, with the AMOC collapsed, against 5.1 °C in the model’s pre-industrial climate.
Once-a-decade cold days fall to about −19 °C in London and −30 °C in Edinburgh, and winter sea ice spreads far further south. One model (CESM).
Show on the mapWest Africa and the Sahel
−37%
Change in June–August rainfall at Niamey, the four-model average after a collapse. Kano: −36%.
All four models agree it gets drier; they differ on how much, from −9% to −61% at Niamey. This is the main rainy season for farming across the Sahel.
Show on the mapSouth Asia
−19%
Change in Indian summer monsoon rainfall, four-model average published by Ben-Yami et al. (2024).
Locally the change is larger in places: about −43% at Mumbai and −43% at Delhi in June–August, with models ranging from −25% to −64% at Mumbai.
Show on the mapCaribbean and South America
−41%
Change in June–August rainfall at Caracas. Farther south the pattern flips: Manaus gets +52% in the same season.
The tropical rain belt moves south, drying Central America, the Caribbean and northern South America while wetting parts of Amazonia and northeast Brazil.
Show on the map
Sea level on Atlantic coasts
As currents reorganise, water piles up in the North Atlantic. In CESM experiments, local sea level rises by up to about 4 mm a year near densely populated coasts during a collapse, comparable to today’s global average rate (van Westen, Katsman & Le Bars, 2026). Not yet mapped here.
A warmer south
Heat no longer carried north stays in the Southern Hemisphere, which warms. This “bipolar seesaw” is seen in models and in records of past abrupt climate change. See the pattern.
Who is most exposed
The regions facing the largest rainfall changes include some of the poorest, most farming-dependent economies, from the Sahel to the Caribbean. Weather shocks already push millions of people into poverty each year (Hallegatte et al., 2016).
Figures for named places are single model grid cells, about 100–250 km across, from idealised experiments. They indicate the direction and rough size of change across a region and should not be read as local forecasts. The four-model average for the West African monsoon in our processing is −28.7%, against −29.1% published by Ben-Yami et al. (2024).

What we observe
Is it already weakening?
Since 2004, instruments moored across the Atlantic at 26.5°N have measured the circulation directly. It averages 17 Sv (sverdrups; one sverdrup is a million cubic metres a second), roughly fifteen times the combined flow of all the world’s rivers, and swings a lot from month to month.
The record shows a weaker state since about 2008 (Smeed et al., 2018), but twenty years is too short to separate a trend from natural variation. Longer, indirect records disagree: a sea-surface temperature fingerprint suggests a decline of about 15% since the mid-twentieth century (Caesar et al., 2018), while a reconstruction from ship-based measurements finds no overall decline since 1981 (Worthington et al., 2021).
What could change
Why scientists talk about a tipping point
Dense, salty water sinking in the far north is one of the engines of the circulation, and the circulation brings salt north. Fresh water or warming weakens the sinking, so less salt arrives, which weakens it further. Beyond a threshold this feedback can carry the AMOC into a much weaker state. In many models that state persists even after the extra fresh water is removed (Weijer et al., 2019). The chart below shows only the slow push towards collapse.
In this experiment, fresh water is added to the North Atlantic of a climate model very slowly, over 2,200 model years. The circulation weakens gradually and then, at about 0.54 Sv of forcing, falls from about 10 Sv to near zero in roughly 150 years, quickly by the standards of this experiment.
The temperature maps above come from runs started at two points on this curve. Starting closer to the threshold, both warming scenarios tip the circulation, to about 1.2 Sv. Starting further away, moderate warming leaves it running at 15.5 Sv, but high warming still brings it down to 3.3 Sv.
Where the real ocean sits on a curve like this is not known. That uncertainty is what the scientific debate is about, and it is why the same model can produce very different futures.
What we know and don’t know
How likely is a collapse?
The IPCC’s latest assessment found the AMOC very likely to weaken this century, with medium confidence that it will not collapse abruptly before 2100. Research since then has pulled in both directions.
Pointing to higher risk
- Early-warning statistics in the fingerprint record suggest lost stability (Boers, 2021; Ditlevsen & Ditlevsen, 2023).
- A physics-based indicator places today’s AMOC on a course towards tipping (van Westen et al., 2024).
- Observation-constrained projections give about 50% weakening by 2100, more than the CMIP6 central estimate (Portmann et al., 2026).
- In every CMIP6 model run beyond 2100 under high emissions, the northern overturning falls to an extremely weak, shallow state (Drijfhout et al., 2025).
- Fast warming can tip the AMOC at lower temperatures than slow warming (van Westen, Börner & Dijkstra, 2026).
Pointing to lower risk
- The IPCC has medium confidence that the AMOC will not collapse abruptly before 2100 (IPCC, 2021).
- Southern Ocean winds sustain a weakened AMOC in 34 models, even under extreme forcing (Baker et al., 2025).
- A 30-year reconstruction at 26°N shows no overall decline (Worthington et al., 2021).
- Statistical early warnings depend on proxies whose link to the AMOC is debated.
| The AMOC will weaken over the 21st centuryIPCC AR6 assessment of models and theory; very likely under all emission scenarios | high |
|---|---|
| An observed long-term decline has already happenedDirect records start in 2004; longer reconstructions and proxies disagree | low |
| A collapse would cool northwest EuropeConsistent across models and past climates; the size of the cooling varies by model | high |
| A collapse would weaken Northern Hemisphere monsoonsDirection consistent across models and palaeoclimate; magnitude varies two- to fivefold between models | medium |
| Whether, or when, a collapse could beginPublished estimates range from mid-century to not this century | low |
Full discussion and references: the AMOC in the science section.
Why it matters for decisions
Planning for a low-likelihood, high-impact risk
On current evidence a collapse this century is a low-likelihood, high-impact risk, and its likelihood is disputed. Planning for it should not displace adaptation that is needed now. Dams, ports, irrigation schemes and crop programmes built today will still be in use when the question is better understood. The direction of many effects is clearer than their size, so the most useful measures are those that help across the range of outcomes. Published estimates of the economic cost of a collapse for developing countries are scarce, and Ocean Turning Points does not yet report any.
- Screen exposure. Identify the countries and sectors most sensitive to a shift in monsoon rainfall or North Atlantic climate.
- Stress-test long-lived investments. Run an AMOC-collapse scenario alongside standard projections.
- Prefer options that work either way. Drought-tolerant farming and flexible water storage pay off whether or not the circulation collapses.
- Link monitoring to decisions. Tie observations from arrays such as RAPID and OSNAP to thresholds that would trigger action.
- Count it in global risk. Reflect AMOC risk in risk assessments and in the case for limiting both the amount and the rate of warming (how much emissions must fall).
These steps follow Jongman and Hall (forthcoming). Brenden Jongman is the curator of Ocean Turning Points.
Which decisions should change
Act now
Long-lived, hard to reverse, and sensitive to the change: decide differently today.
- Long-lived assets designed now in exposed regions, such as water storage in the Sahel or ports on Atlantic coasts: build in margins or adjustability rather than sizing to the average projection.
- Keep the Atlantic observing arrays funded; a gap in the record cannot be made up later.
Assess now
High stakes but unclear answers: stress-test, monitor and set trigger points.
- Screen which countries and portfolios are most exposed, and stress-test investments, design standards and climate finance against weakening and collapse scenarios.
- Link Atlantic monitoring to trigger points at which plans and standards are reviewed.
- Carry a collapse, and its carbon-cycle feedback, as an explicit scenario in carbon budgets.
Stay the course
Pays off whatever happens, or is cheap to adjust later: keep going.
- Drought-tolerant crops, efficient irrigation, social protection and early warning remain valuable whether or not the circulation weakens.
The three decision types are Ocean Turning Points’ own lens, built on research on deciding under deep uncertainty. How to decide under uncertainty.
What this change means region by region and sector by sector
References and data
About these data
All data are published, openly licensed model output and observations, processed with a documented, reproducible pipeline. Values are not smoothed or re-scaled beyond what is described here. Methods for the whole site.
Temperature: one model, five climate states
Source: van Westen & Baatsen (2025), Geophysical Research Letters, doi:10.1029/2025GL114611; data doi:10.5281/zenodo.15490235, CC BY 4.0. Model: CESM 1.0.5, atmosphere about 2°, ocean about 1°. Each state is a 100-year average. Greenhouse forcing follows RCP4.5 or RCP8.5 to 2100 and is then held fixed; ice sheets are fixed. “+2 °C” and “+4 °C” are approximate global warming in these runs relative to pre-industrial.
| State | Background fresh water | AMOC | Model run |
|---|---|---|---|
| Pre-industrial climate, AMOC intact | 0.45 Sv | 12.4 Sv | CESM_1500_PI |
| Pre-industrial climate, AMOC collapsed | 0.45 Sv | collapsed | CESM_2900_PI |
| About +2 °C world, AMOC intact | 0.18 Sv | 15.5 Sv | CESM_0600_RCP45 |
| About +2 °C world, AMOC collapsed | 0.45 Sv | 1.2 Sv | CESM_1500_RCP45 |
| About +4 °C world, AMOC collapsed | 0.45 Sv | 1.2 Sv | CESM_1500_RCP85 |
We matched the published files to model runs by comparing them with the authors’ run-level data (agreement within about 0.1 °C). Comparisons between states with the same background fresh water isolate the collapse cleanly; the two that mix 0.18 and 0.45 Sv are flagged in the explorer. Cold and hot extremes are once-in-ten-year values from extreme-value fits by the original authors. A similar view of these scenarios for Europe is at amocscenarios.org, made by the same research group.
Rainfall: four models after the same experiment
Method from Ben-Yami et al. (2024), Earth’s Future, doi:10.1029/2023EF003959; data from NAHosMIP (Jackson, Bellomo et al.), doi:10.5281/zenodo.14884357, CC BY 4.0, protocol Jackson et al. (2023). Models: HadGEM3-GC31-MM, CanESM5, CESM2, IPSL-CM6A-LR.
For each model, rainfall after its AMOC has collapsed, and after the added fresh water has been switched off, is compared with the same model’s pre-industrial climate. The difference therefore reflects the collapse itself. Percentage changes are computed per model, interpolated to a common 0.5° grid, then averaged. Areas where any model’s control climate gets less than 0.3 mm a day are left blank. As the original authors caution, with four models the average shows the pattern where models agree; it is not the most accurate prediction.
Check against the paper (annual means over approximate regional boxes; the paper’s exact regions differ):
- West African monsoon: ours −28.7%, published −29.1%
- Indian summer monsoon: ours −23.5%, published −18.8%
- Southern Amazon: ours +12.3%, published +43.8%
The West African figure matches closely. Our Indian and southern Amazon boxes only approximate the paper’s regions: for the southern Amazon our box gives a much smaller wetting than the paper reports, so treat the size there as uncertain. Where this page quotes regional monsoon changes, it uses the published figures.
Observations and model time series
RAPID-MOCHA-WBTS array at 26.5°N, v2024.1a, National Oceanography Centre and partners, doi:10.5285/48d0bf43-0598-ceb2-e063-7086abc062f1. Variable: overturning transport, 10-day low-pass filtered; we show monthly and calendar-year means. The freshwater experiment is from van Westen & Baatsen (2026), doi:10.5281/zenodo.18785979, described in van Westen, Kliphuis & Dijkstra (2024). Scenario-run time series: doi:10.5281/zenodo.14586440.