The ocean now
Today’s signals of the big changes: sea temperatures, marine heatwaves and coral heat stress, El Niño, fishing, and sea ice at both poles. Updated daily from satellites, ocean buoys and vessel tracking.
What it shows
How much warmer or colder the sea surface is than the 1985–2012 average for the same day, from satellite measurements blended into a daily 5 km product (shown here at 0.25°).
Why it matters
The warm band along the equatorial Pacific is El Niño. Large warm patches elsewhere are marine heatwaves, which bleach corals, move fish stocks and fuel heavy rain on nearby coasts. El Niño · coral reefs
Source
Observed NOAA Coral Reef Watch, CoralTemp v3.1 SST anomaly. Product page. Near-coast pixels are less reliable. Sea ice (white, where at least 15% of the sea is ice) is from the same product.
Tropical Pacific
A strong El Niño is under way
- NOAA status
- El Niño Advisory
- Central Pacific sea temperature compared with normal (Niño-3.4), week of 21 October 2026
- +3.4°C
- The same, minus the warming of the whole tropics (relative index)
- +2.5°C
- Three-month relative index, used by NOAA to judge strength (JAS 2026)
- +1.69°C
Sea-surface temperatures in the central-eastern equatorial Pacific are +3.4°C above normal, the highest weekly value in NOAA’s record, which starts in 1981. The relative index subtracts the warming of the whole tropics, which is how NOAA now judges El Niño strength. On the three-month relative index this event has not yet passed the 1982–83 peak of +2.4°C.
El Niño shifts rainfall around the world. It typically brings drought to southern Africa, Indonesia, Australia, Central America and northern South America, heavy rain to coastal Peru and Ecuador and parts of East Africa, and mass coral bleaching. Its effect on global temperature peaks in the following year.
Hover or tap the chart to read weekly values.
Strong El Niño years stand out: 1972–73, 1982–83, 1997–98, 2015–16, and now 2026.
Observed NOAA Climate Prediction Center: weekly Niño indices (OISST v2.1, 1991–2020 base), Oceanic Niño Index and Relative Oceanic Niño Index (ERSSTv6). The indices use a 1991–2020 normal; the globe above uses Coral Reef Watch’s 1985–2012 normal, so values differ slightly. Status from the ENSO diagnostic discussion of 8 October 2026. NOAA discussion
The ocean surface
A new record in 2026
- Average sea-surface temperature, 60°S–60°N, 25 October 2026
- 21.0°C
- Compared with the 1991–2020 average for the same day
- +0.82°C
On 26 August 2026 the average ocean surface reached 21.18°C, the highest daily value since the satellite record began in 1982, essentially level with the previous peak of 21.17°C in 2024. The ocean surface has warmed with the climate, and El Niño years add a temporary boost on top.
2026 in red, 2025 in dark grey, 2023 and 2024 in mid grey, earlier years in light grey; dashed: the 1991–2020 average.
Observed Climate Reanalyzer, Climate Change Institute, University of Maine (CC BY 4.0), from NOAA OISST v2.1. The most recent days are preliminary.
Sea ice
Sea ice at both poles
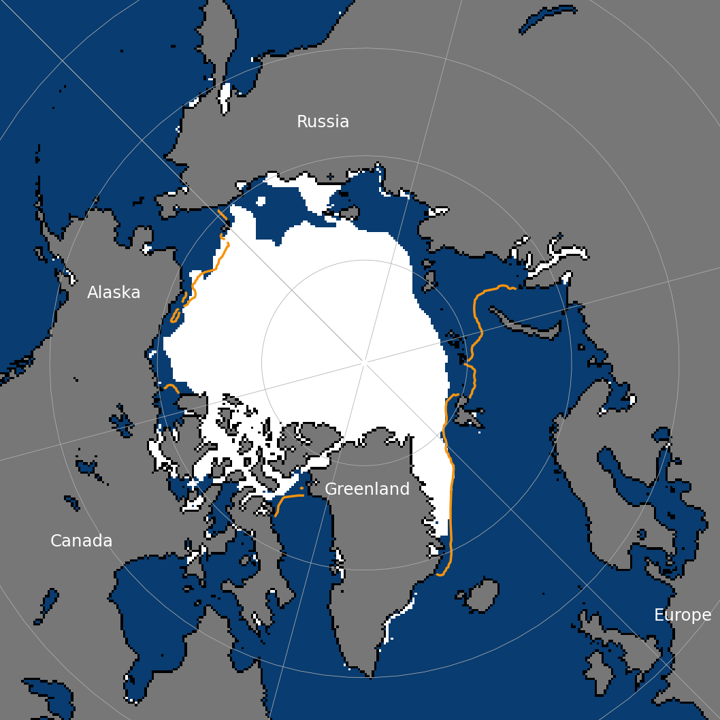
Arctic: this year (red), last year (grey), the 1981–2010 median (dashed) and the lowest on record for each day (dotted).
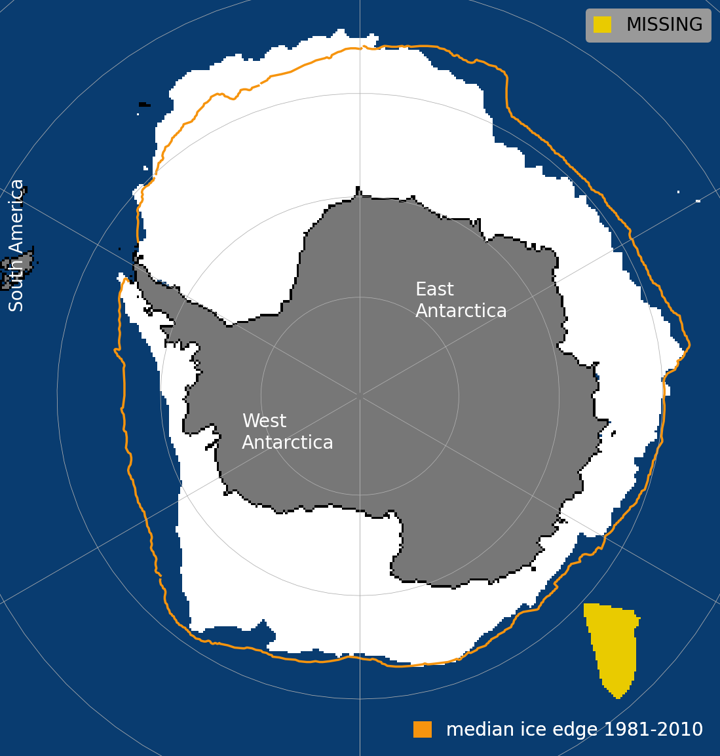
Antarctic: this year (red), last year (grey), the 1981–2010 median (dashed) and the lowest on record for each day (dotted).
Observed National Snow and Ice Data Center, Sea Ice Index version 4 (doi:10.7265/a98x-0f50): daily extent maps and values. Extent is the area of ocean with at least 15% ice. Maps: white is ice, orange is the median ice edge for 1981–2010; yellow marks missing satellite data. Antarctic sea ice and the Southern Ocean.
Data refreshed 26 October 2026.