A warmer ocean holds fewer fish, and the fish it holds are moving towards the poles and across borders. The countries that depend most on fish for food and income have the least room to adapt.
- What is it?
- Warming shrinks the amount of fish the ocean can support and shifts where they live. Marine heatwaves can wipe out whole stocks within a year or two.
- How likely is it?
- Already under way: warming cut sustainable fish yields by 4% over 1930–2010. Models project about 5% less fish for every degree of warming (medium confidence).
- What would it mean?
- Less food and income for coastal communities, lost revenue for small island states, and disputes over stocks that cross borders.
- What can be done?
- Limit warming, end overfishing, and adapt quotas and agreements as stocks move. Rebuilt and protected stocks cope better.
Model projectionsObserved changesReviewed 25 October 2026
What we observe
Observed shifts and collapses
Fish and other marine animals have moved towards the poles by about 59 km a decade since the 1950s (IPCC, 2022, high confidence). Warming reduced the sustainable yield of 235 fish populations by 4.1% between 1930 and 2010, and by 15–35% in five regions (Free et al., 2019). Catches around the world are increasingly made up of warm-water species (Cheung et al., 2013).
The sharpest losses come from marine heatwaves. The IPCC finds with high confidence that they have caused the collapse of regional fisheries and aquaculture. Where heat combines with heavy fishing, a stock can collapse and fail to recover, the closest that fisheries come to a tipping point.
- −71%Pacific cod in the Gulf of Alaska after the 2014–16 marine heatwave, a fishery worth US$103 million (Barbeaux et al., 2020).
- 10 billionsnow crabs vanished from the Bering Sea after the 2018–19 heatwave (Szuwalski et al., 2023).
- −90%bull kelp along 350 km of northern California after 2014, closing a US$44 million abalone fishery (Rogers-Bennett and Catton, 2019).
- 5 yearsof consecutive mass die-offs across the Mediterranean, 2015–2019, affecting 50 groups of species (Garrabou et al., 2022).
How likely
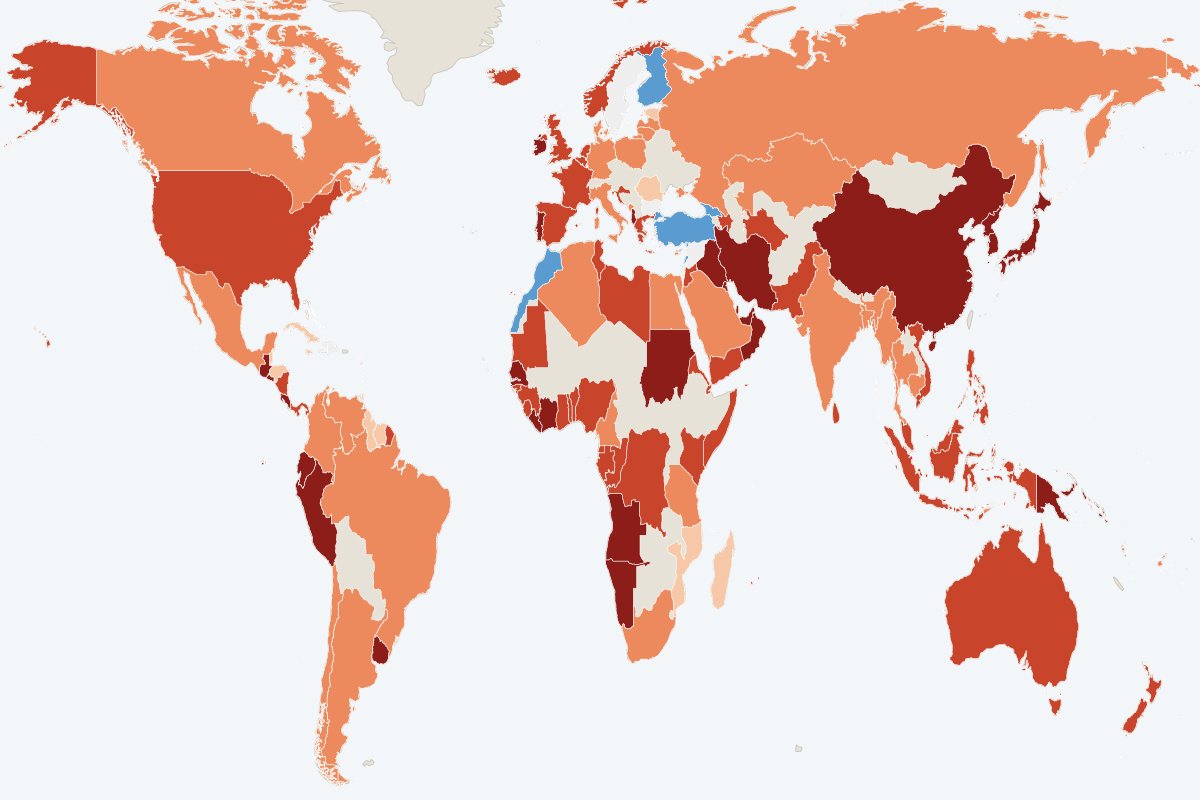
Projected fish biomass by country
Ecosystem models project about 5% less marine animal life for every degree of warming (Lotze et al., 2019). By 2100 the latest model ensemble projects a 19% decline under very high emissions and 7% under low emissions (Tittensor et al., 2021). The IPCC gives a range of about 6% to 16% with medium confidence.
Country by country, the fish that national waters can hold falls by a median of 21.9% by the 2090s under very high emissions, and in 139 of 148 countries. Under low emissions the median loss is 5.2%. The biggest losses are in the tropics, including Papua New Guinea, the Solomon Islands, Senegal and Peru, but countries such as Norway and the United Kingdom also lose (Blanchard and Novaglio, 2024).
Is this a tipping point?
Partly. The global decline is gradual, roughly in step with warming. Individual systems can tip: the Global Tipping Points Report 2023 has high confidence that cod fisheries and kelp forests can pass tipping points, from which recovery is slow. Newfoundland’s cod took more than two decades to recover only partly after its collapse.
Median change in fish biomass by the 2090s, by continent
Countries’ national waters, relative to 2005–2014
Very high emissions Low emissions
Oceania
Africa
Asia
Europe
Americas
What it would mean
Food, jobs and public revenue
- 65 millionpeople work in fishing and fish farming, 85% of them in Asia (FAO, 2026).
- 40%+of the world’s people get at least a fifth of their animal protein from fish and other aquatic foods (FAO, 2026).
- Up to 84%of government revenue comes from tuna fishing licences in some Pacific island states (FAO, 2026).
- US$90 milliona year in tuna access fees lost by 10 Pacific island states by 2050 under high emissions, as tuna move to the high seas (Bell et al., 2021).
- 23%of fish stocks shared between countries will have shifted by 2030, affecting 78% of national waters (Palacios-Abrantes et al., 2022).
- ×3the fishing pressure, and half the fish, in regions without strong fisheries management (Hilborn et al., 2020).
Fish matter most for nutrition in tropical countries, where reef and coastal fish supply iron, zinc and calcium that diets lack (Hicks et al., 2019). Reef fisheries are covered on the coral reefs page.

What can be done
Emissions, fisheries management and protection
Limit warming
The difference between emissions pathways is the largest lever: a median loss of 5.2% against 21.9% by the 2090s. Mitigation lowers the risk for almost all of 25,000 species assessed, and benefits food-insecure people in low-income countries most (Boyce et al., 2022). How much emissions must fall.
End overfishing
The IPCC finds with very high confidence that management that eliminates overfishing helps fisheries adapt. Where stocks are assessed and managed, they are on average increasing (Hilborn et al., 2020). Rebuilt stocks partly offset losses from warming, especially under low emissions (FAO, 2026).
Plan for stocks that move
Quotas, licences and agreements built on where fish used to be will come under strain as stocks cross borders. Agreements that can adjust shares as fish move reduce the risk of conflict and lost revenue; governance is not yet prepared for this (Pinsky et al., 2018).
Protect and restore
Fully protected areas rebuild fish populations, and fish spill over into nearby fisheries. Plan nutrition and livelihoods for coastal communities where catches are projected to fall most. Where the ocean has recovered.
Which decisions should change
Act now
Long-lived, hard to reverse, and sensitive to the change: decide differently today.
- New or renegotiated fisheries agreements should include rules for stocks that move across borders.
Assess now
High stakes but unclear answers: stress-test, monitor and set trigger points.
- Test port, processing and fleet investments that depend on particular stocks or fishing grounds.
- Plan nutrition and livelihoods where catches are projected to fall most.
Stay the course
Pays off whatever happens, or is cheap to adjust later: keep going.
- End overfishing, cut other pressures and diversify livelihoods: healthy stocks cope better with warming.
The three decision types are Ocean Turning Points’ own lens, built on research on deciding under deep uncertainty. How to decide under uncertainty.
What this change means region by region and sector by sector
About these data and sources
Map and continent chart: FishMIP ensemble projections of exploitable fish biomass (10 g to 100 kg, without fishing) in national waters, relative to 2005–2014: Blanchard, J. L. & Novaglio, C. (eds) (2024), FAO Fisheries and Aquaculture Technical Paper 707, doi:10.4060/cd1379en; data doi:10.5281/zenodo.13988998 (Apache-2.0). Country shapes: Natural Earth.
Studies: IPCC AR6 Working Group II, Chapter 3 (Cooley et al., 2022); Free et al. (2019), Science 363; Cheung et al. (2013), Nature 497; Lotze et al. (2019), PNAS 116; Tittensor et al. (2021), Nature Climate Change 11; Barbeaux et al. (2020), Frontiers in Marine Science 7; Szuwalski et al. (2023), Science 382; Rogers-Bennett & Catton (2019), Scientific Reports 9; Garrabou et al. (2022), Global Change Biology 28; Bell et al. (2021), Nature Sustainability 4; Palacios-Abrantes et al. (2022), Global Change Biology 28; Pinsky et al. (2018), Science 360; Hilborn et al. (2020), PNAS 117; Boyce et al. (2022), Nature Climate Change 12; Hicks et al. (2019), Nature 574; FAO (2026), The State of World Fisheries and Aquaculture 2026; Global Tipping Points Report 2023.